- Company
- Trading FAQ
Trading FAQ - Frequently Asked Questions
Trading Conditions
Trading platforms
Money Transfer
General questions
Trading Conditions
For trading you may be charged the following fees:
- Spread, which is the difference between the Bid and Ask prices. You can find our spread values on the instrument specification page
- SWAP. When trading Forex and CFDs, each open position transferred to the next trading day may be charged with a certain fee, named SWAP. SWAP fee can be either positive or negative. You can find our SWAP values on the trading instruments specification page.
- Commission. For opening and closing a position you may be charged a certain commission. Commission is charged for trading in ECN account type and for trading in certain instrument types, such as stocks and ETFs.
Minimum initial deposit amount depends on the trading account type. Please also check the limits of the deposit method you intend to use.
Minimum trading volume depends on your trading account type and the trading instrument specification.
Maximum leverage depends on the trading account type. You can find full information on the trading account types page.
You can change your account leverage and type through your personal cabinet on our website. Please note, that certain restrictions may apply (e.g. it may be not possible to change some account types, or you may be required to close all the positions before executing your request).
You can select account balance currency while opening a trading account. Available currencies may depend on the trading platform. You can find full information on the trading account types page.
You can have only one account of a particular type. Type is determined by the following parameters: trading platform, account type, balance currency, netting/hedged.
E.g. you can not open two USD Metatrader 5 Direct Micro hedged accounts, but you can open one USD Metatrader 5 Direct Micro hedged account and one USD Metatrader 5 Direct Standard hedged account.
Yes, you can open a Standard-ECN account for trading on the MetaTrader 5 platform with your chosen balance currency and Hedged/Netting position accounting system.
The source of quotes for this account is the ECN (Electronic Communication Network) trading platform with a large number of liquidity providers. This allows IFCMarkets to receive significantly smaller floating spreads for your trading.
The main differences between an ECN account and other types of accounts at IFCMarkets:
- 1. A shortened list of financial instruments - 22 currency pairs, as well as gold and silver.
- 2. A commission per transaction of 0.005% of the transaction volume.
By default, charts in MetaTrader and NetTradeX platforms reflect only Bid prices. But BUY order levels displayed on the charts utilize Ask prices. So if your Take Profit order is linked to a SELL position, whuch is closed by a BUY order, it should be executed when Ask price reaches it.
Please note, that you can display current Ask price on the chart for:
MetaTrader (PC version)
- 1. Right-click on the chart and select "Properties"
- 2. In the "Properties" window, click the "Common" tab
- 3. Tick "Show Ask line" and then click "Ok"
NetTradeX (PC version)
1. Right-click on the chart and select "Show" > “Ask line”
However candles in Metatrader and NetTradeX only include the bid price and there is no feature for displaying historic ask prices.
By default, charts in MetaTrader and NetTradeX platforms reflect only Bid prices. But BUY order levels displayed on the charts utilize Ask prices. So if your Stop Loss order is linked to a SELL position which is closed by BUY order, it should be executed when Ask price reaches it.
Please note, that you can display current Ask price on the chart for
MetaTrader (PC version)
- 1. Right-click on the chart and select "Properties"
- 2. In the "Properties" window, click the "Common" tab
- 3. Tick "Show Ask line" and then click "Ok"
NetTradeX (PC version)
1. Right-click on the chart and select "Show" > “Ask line”
However candles in Metatrader and NetTradeX only include the bid price and there is no feature for displaying historic ask prices.
Margin level (percentage) is calculated as Equity/Margin * 100%. Equity is calculated as the sum of the balance and profit/loss of open positions.
Short margin (Stop Out) is a process of automatic position(s) closure if your trading account is low on margin. If the equity/margin ratio of your account falls below the Short Margin Level (defined on the trading account types page) we will automatically close your open positions, starting from the one with the biggest loss. Positions are closed one by one until equity/margin ratio raises above the Short Margin Level.
Yes, scalping is allowed.
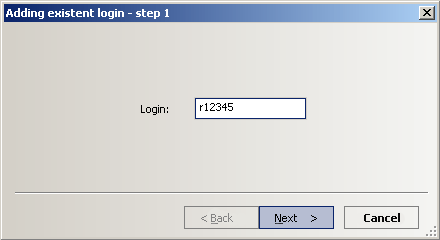
If you want to access your trading account for the first time (or from another PC), go to "File" in the main menu and choose "Create existent login" option from the context menu.

An "Adding existent login" dialogue window will be opened:
Enter your login name (rХХХХХ - for real account, or demoХХХХХХ - for demo account) and click "Next".
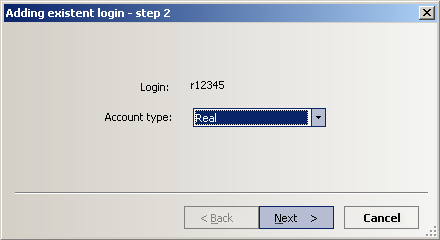
Select a type of account (Real or Demo) and click "Next".
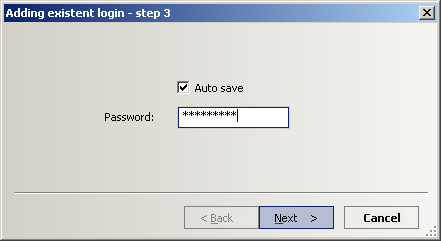
Tick the "Save password" box (if you want to save your password), enter your password and click "Next".
After creating the login, you will see it in “Navigator” window, under the section "Logins". To log in you will just need to double click on it and press “OK” or right click on it, press “Connect” and “OK”.
NOTE: Existent login is added only once on every PC you access your trading account from.
Server name depends on the account type you have:
- Real accounts: IFCMarkets-Real
- Demo accounts: IFCMarkets-Demo
Most probably you used Investor Password for loggin in. Such password type allows only monitoring the account, you can not trade with it. To start trading please log in using your Trading Password. You can find your Trading Password in the email with account details.
After opening a new trading account we will send you all the login details to your registered email. Please check your inbox and spam box as well. The subject of the email is "New trading account".
If you do not hold any funds and do not use your trading account for a significant amount of time, it will become inactive. If your account is inactive, it’s status will be displayed in your website cabinet. Inactive accounts can not be logged in. To reactivate your trading account you need to fund it. Afterwards it will be immediately activated and you will be able to log in.
We use CET (Central European Time) and CEST (Central European Summer Time) for our trading platforms. Transfer from CEST to CET and vice versa is performed on the last Sunday in March (between 25 and 31 March) on the last Sunday in October (between 25 and 31 October). The trading hours of all trading instruments are changed accordingly, if applicable.
Timezone is fixed for all our trading platforms and can not be changed.
For each trading platform (NetTradeX, MetaTrader 4 and MetaTrader 5) a separate trading account must be created. But you can use internal transfer to move funds from one trading account to another.
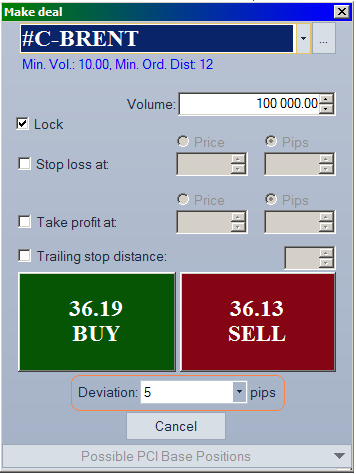
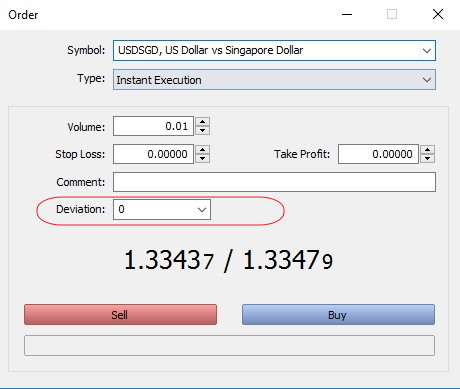
In case of high volatility after the release of important news or poor internet connection requote is possible (cancellation of the order execution and an offer of a new price), as the price has significantly changed while the request was passing from the client's terminal to the company's server. To avoid a requote when creating an order you need to set maximum allowed deviation - the allowed deviation from the requested order price. When setting a deviation the order will be executed at the current price, if the difference between the requested and current prices is less than the set deviation.
In NetTradeX platform the deviation is set in pips in the Make deal window.
In MetaTrader 4 platform the deviation is set in the same window as well.
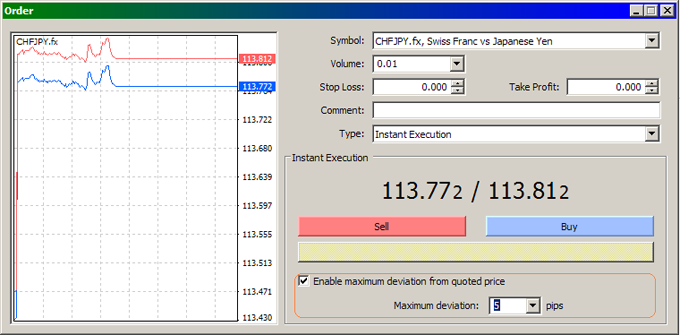
In MetaTrader 5 the deviation is set in the same window
The depositing and withdrawing fees are displayed on the deposit and withdrawal methods pages. Please note, that additional fees may be imposed on you by your bank or your payment service provider.
The deposit processing time depends on the payment method. You can check the processing time for each deposit method on the deposit methods page. Please note, that deposit methods which are not processed instantly are usually processed only during Back Office working hours.
Usually all withdrawal requests are performed within an hour during Back Office working hours. In some cases it may take up to 48 working hours to perform the request. Please note, that after a withdrawal is performed by us it may need some time for the funds to reach you (which depends on the payment system). You can find rough estimation of such time on the withdrawal methods page in the processing time field for each withdrawal method.
To find out why you can not file a withdrawal from a specific trading account we advise you to check the following:
- You do not have unperformed withdrawal requests from this trading account. According to our rules, you can not file a new withdrawal frequest frrom the account while the previous one has not been performed
- Your trading account password has been changed and you need to enter it in the trading accounts list to operate your trading account further.
According to the cryptocurrency deposit procedure we need to receive from you the exact sum specified in the deposit request. In case you have sent incorrect amount please contact our support team to receive the instructions on how to proceed. To avoid such situation please check all the commissions which may be charged for the transfer by third-parties. For instance, crypto payment service providers (like Binance or other) may charge additional fee which may decrease the transfer amount.
Please also pay attention that the transfer should be received by us within the timeframe specified in the deposit procedure. In case the timer has expired, please restart the deposit procedure or contact our support team.
Due to our regulational requirements, the funds can be withdrawn only through the payment system used for depositing them. In case you are unable to withdraw the funds to the system you used for depositing, please contact our support team.
In case you have used several payment systems for funding your account we reserve the right to request you to withdraw the funds to any of such payment systems according to our internal policies.
No, IFC Markets accepts deposits from and make withdrawals to payment accounts which belong to the account owner.
Yes, we provide educational materials for the beginners. Educational part of our website covers all the basics of trading in Forex and CFD markets, technical analysis and much more. Also we have several educational books that will be useful for the newcomers. For more information, please, go to trading books section.
IFC Markets is an STP broker (Straight-through processing - automatic realization of transactions with financial instruments). This means that we receive quotations from our liquidity providers, and accumulated clients’ orders are transferred to the marketplaces, accordingly.
You can see the details of our scheme on the page Model of Order Execution.
Back office operational time: Mon - Fri, 08:00 to 20:00 , Sat - Sun, 07:00 - 15:30(CET)
To reset your password for the website cabinet follow the link.
To get a new password for your trading account you need to complete the relevant procedure through our website cabinet. To start the procedure follow the link and click “three dots” in the top right corner of the relevant trading account.
Commonly, we do not make it mandatory to authorize your profile to trade with us. However, until your profile is authorized you may face some restrictions in utilizing our services (e.g. depositing/withdrawing restrictions). Please also note, that due to the regulatory AML/KYC policies we may request you to authorize your profile at any time according to the regulational requirements.
You can authorize your profile through our website cabinet. Please visit the Profile Authorization Page and submit the authorization form.
Generally, if the balance of your account has become negative we will automatically return it to zero. If that does not happen, you can file a request through your website cabinet.
In MetaTrader 4 and 5 trading platform negative balance compensation is performed through “credit” operation, which results in zero equity, but your balance will still remain negative. Please note, that negative balance does not itself affects your trading activity, as you can use the “credit” funds for further operating in your account.
Yes. With our partnership program you can profit from referring clients to IFC Markets, earning commission for each deal your clients close. For more information, please, go to our partnership section.
Yes, you can find more about the trading signals we provide on the trading signals page.