- Analytics
- Technical Analysis
Brent Crude Oil Technical Analysis - Brent Crude Oil Trading: 2016-12-01
OPEC cuts oil production first since 2008
OPEC cut production 4.5% or about 1.2mln barrels a day for the first time since 2008. Brent oil prices soared 8% almost immediately. Will they continue advancing?
Oil production volumes of OPEC reached 33.7mln barrels per day in November, according to preliminary estimates. OPEC decided on Wednesday to cut production to 32.5mln barrels per day since January 1st, 2017. The cartel believes that independent oil producers are to cut production simultaneously by 600 thousand barrels. For now, the agreement will be valid till the next official OPEC meeting scheduled on May 24, 2017. Brent cost $107 per barrel in 1st half of 2014. At the same time, OPEC produced around 30.75mln barrels a day while global production was 92.25mln bpd. The current volumes of oil production are much higher and are estimated to be 96.3mln bpd. After decision of OPEC and independent oil producers oil production volumes are to fall to 94.5mln bpd since the start of 2017. In theory, the decline may support Brent oil prices. We believe global demand advanced around 3mln bpd in recent 2-1/2 years which also supports growth. Main factor which may hinder the rally in global oil market is possibility of sharp increase in shale oil output in US. Higher oil prices significantly raise its profitability.
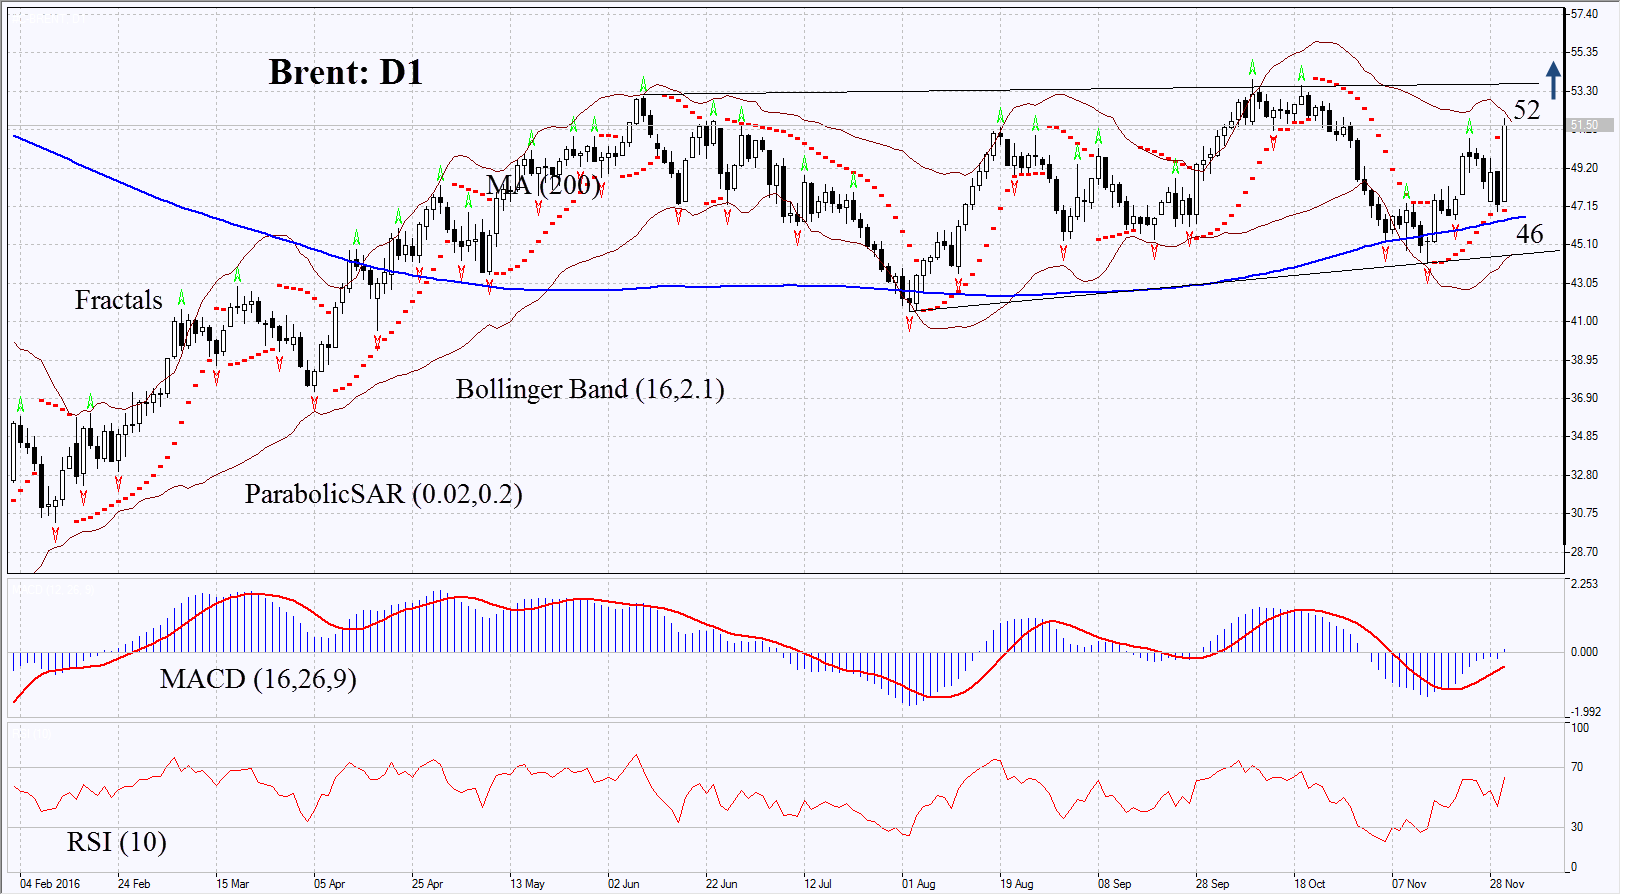
On the daily chart Brent: D1 is within the sideways channel. It is rising but has not yet reached the upper boundary. Further price increase is possible in case high global demand for oil persists, in case independent oil producers support OPEC decision and in case of slow production increase in US shale oil fields.
- Parabolic gives bullish signal.
- Bollinger bands have narrowed which means lower volatility.
- RSI surpassed the level of 50 but has not yet reached the overbought zone. No divergence.
- MACD gives bullish signal.
The bullish momentum may develop in case Brent surpasses the last fractal high and the upper Bollinger band at 52. This level may serve the point of entry. The initial stop-loss may be placed below the last fractal low, the Parabolic signal and 200-day moving average at 46. Having opened the pending order we shall move the stop to the next fractal low following the Parabolic and Bollinger signals. Thus, we are changing the probable profit/loss ratio to the breakeven point. The most risk-averse traders may switch to the 4-hour chart after the trade and place there a stop-loss moving it in the direction of the trade. If the price meets the stop-loss level at 52 without reaching the order at 46, we recommend cancelling the position: the market sustains internal changes which were not taken into account.
Summary of technical analysis
| Position | Buy |
| Buy stop | above 52 |
| Stop loss | below 46 |
- Get Certificate

Note:
This overview has an informative and tutorial character and is published for free. All the data, included in the overview, are received from public sources, recognized as more or less reliable. Moreover, there is no guarantee that the indicated information is full and precise. Overviews are not updated. The whole information in each overview, including opinion, indicators, charts and anything else, is provided only for familiarization purposes and is not financial advice or а recommendation. The whole text and its any part, as well as the charts cannot be considered as an offer to make a deal with any asset. IFC Markets and its employees under any circumstances are not liable for any action taken by someone else during or after reading the overview.
