- Analytics
- Technical Analysis
Cotton Technical Analysis - Cotton Trading: 2016-11-11
Cotton prices rise despite world crop upgrade
Cotton prices declined on bearish news the US Department of Agriculture revised upward US and global production and ending stocks for 2016 -17. Will cotton continue falling?
In the November 9 World Agricultural Supply and Demand Estimates report, the US Department of Agriculture revised upward the US cotton production to 16.16m 480-pound bales from an estimate of 16.03m bales made in October. A sharp rise in the crop estimate in Texas was the main reason for the upgrade despite lowered estimates for production in the South East. The US ending stocks were also forecast to rise to 4.50m bales in 2016 -17 from an earlier estimate of 4.30m bales. The global supply estimates were also upgraded together with production and season-end stocks: the world production was raised to 103.3m bales due to a 500000-bale increase in India crop estimate, as world ending stocks were upgraded to 88.3m bales, an upgrade of nearly 1m bales from previous month's forecast. Prices retreated on higher supply forecast.
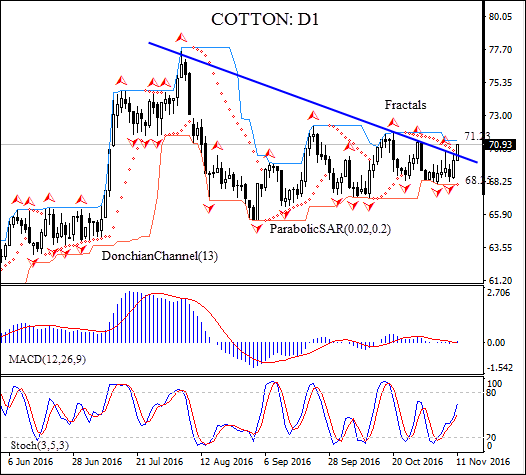
On the daily timeframe the Cotton: D1 has been retracing higher following the decline after hitting 26-month high in early August. The price has breached above the resistance line and the fractal high.
- The Parabolic indicator has formed a buy signal.
- The Donchian channel is flat, indicating no trend yet.
- The MACD indicator gives a bullish signal.
- The Stochastic oscillator is rising and has not reached the overbought zone.
We expect the bullish momentum will continue after the price breaches above the upper Donchian bound at 71.23. This level can be used as an entry point for a pending order to buy. The stop loss can be placed below the fractal low at 68.25. After placing the pending order, the stop loss is to be moved to the next fractal low, following Parabolic signals. By doing so, we are changing the probable profit/loss ratio to the breakeven point. If the price meets the stop loss level (68.25) without reaching the order (71.23), we recommend canceling the position: the market sustains internal changes which were not taken into account.
Technical Analysis Summary
| Position | Buy |
| Buy stop | Above 70.23 |
| Stop loss | Below 68.25 |
- Get Certificate

Note:
This overview has an informative and tutorial character and is published for free. All the data, included in the overview, are received from public sources, recognized as more or less reliable. Moreover, there is no guarantee that the indicated information is full and precise. Overviews are not updated. The whole information in each overview, including opinion, indicators, charts and anything else, is provided only for familiarization purposes and is not financial advice or а recommendation. The whole text and its any part, as well as the charts cannot be considered as an offer to make a deal with any asset. IFC Markets and its employees under any circumstances are not liable for any action taken by someone else during or after reading the overview.
