- Analytics
- Technical Analysis
DE 30 Technical Analysis - DE 30 Trading: 2017-02-07
"Diesel scandal" of Volkswagen may continue in Europe
Luxembourg brought criminal charges against the German automaker Volkswagen as part of the “diesel scandal” which previously was under way in US. Will the German DAX index advance?
Volkswagen stocks lost 2% on Monday while DAX index fell 1.2%. Previously the German automaker said it will appropriate 18.2bn euros to settle the “diesel scandal” but the sum mainly concerned the costs in US. The lawsuit of Luxembourg is the first within the European Union. Investors worry it may be followed with other suits from European consumers. Volkswagen accounts for around 6.3% of the DAX capitalization. The campaign weighed on stock indices despite the positive economic data which came out on Monday. The factory orders in Germany for December 2016 surged and surpassed the forecasts. The manufacturing data for December will come out in Germany on Tuesday and the trade balance for December on Thursday. They may affect German stocks in case they differ a lot from expectations. The preliminary forecast is neutral in our opinion.
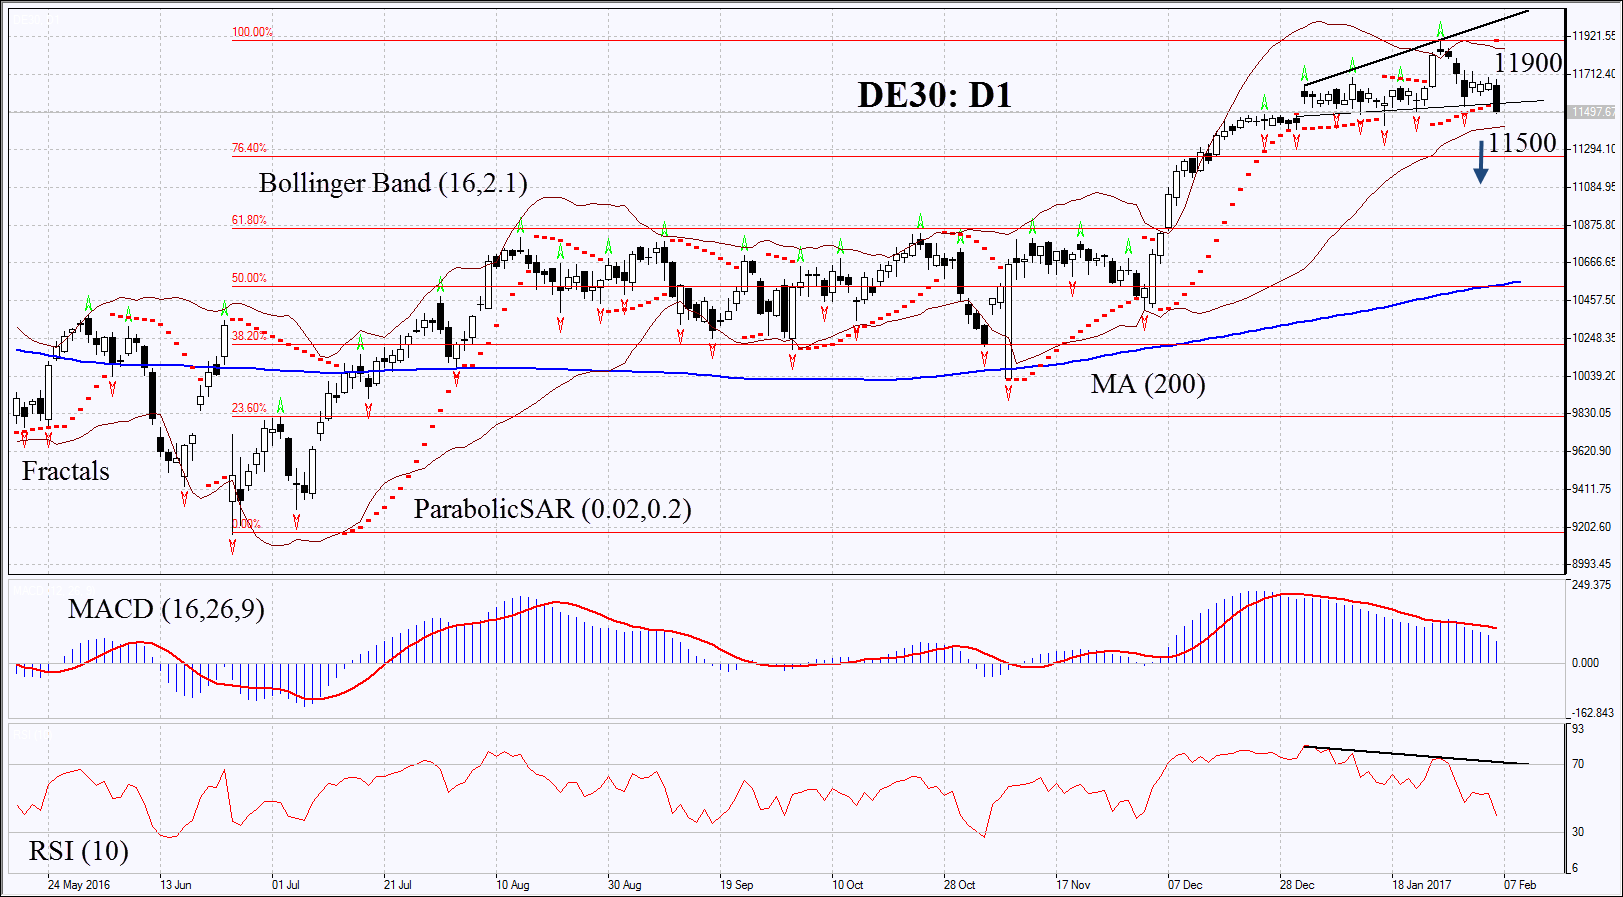
On the daily chart DE30: D1 is slightly correcting down having hit a 20-month high two weeks ago. Its further decline is possible in case the negative corporate and economic data came out in Europe and Germany and in case of further developments of Volkswagen diesel scandal.
- The Parabolic indicator gives bearish signal.
- The Bollinger bands have narrowed a lot which means low volatility. They are tilted downward.
- The RSI indicator is below 50 having formed negative divergence.
- The MACD is giving bearish signals.
The bearish momentum may develop in case the DE30 falls below the two last fractal lows at 11500. This level may serve the point of entry. The initial stop-loss may be placed above the 20-month high, the last fractal high, the upper Bollinger band and the Parabolic signal at 11900. Having opened the pending order we shall move the stop to the next fractal high following the Parabolic and Bollinger signals. Thus, we are changing the probable profit/loss ratio to the breakeven point. The most risk-averse traders may switch to the 4-hour chart after the trade and place there a stop-loss moving it in the direction of the trade. If the price meets the stop-loss level at 11900 without reaching the order at 11500, we recommend cancelling the position: the market sustains internal changes which were not taken into account.
Summary of technical analysis
| Position | Sell |
| Sell stop | below 11500 |
| Stop loss | above 11900 |
- Get Certificate

Note:
This overview has an informative and tutorial character and is published for free. All the data, included in the overview, are received from public sources, recognized as more or less reliable. Moreover, there is no guarantee that the indicated information is full and precise. Overviews are not updated. The whole information in each overview, including opinion, indicators, charts and anything else, is provided only for familiarization purposes and is not financial advice or а recommendation. The whole text and its any part, as well as the charts cannot be considered as an offer to make a deal with any asset. IFC Markets and its employees under any circumstances are not liable for any action taken by someone else during or after reading the overview.
