- Analytics
- Technical Analysis
EUR USD Technical Analysis - EUR USD Trading: 2014-12-22
Tendency continuation
Let’s consider an H4 chart of EUR/USD instrument. As oil prices keep falling and FED reports have positive decline, we observe the US dollar strengthening against the most liquid currencies. European currency is not an exception as well. The price keeps moving in frame of H4, D1 tendencies – the scale synchronization is observed. A signal of trend indicator ParabolicSAR slides along a four-hour trend line, thus confirming the bearish direction. The slope of the Donchian channel is also directed toward the red zone. The only alarm at the moment is a breakdown of the RSI-Bars trend line. The signal can be false only if the 19.3150% support intersection occurs. Most likely, that at this moment the price overcomes a fractal mark of 1.22147, which can be used for pending order opening. At the same time an intersection of Donchian Channel lower boundary is expected. Risks can be limited above the resistance 1.23061, which coincides with the trend line H4 and the historical values of Parabolic.
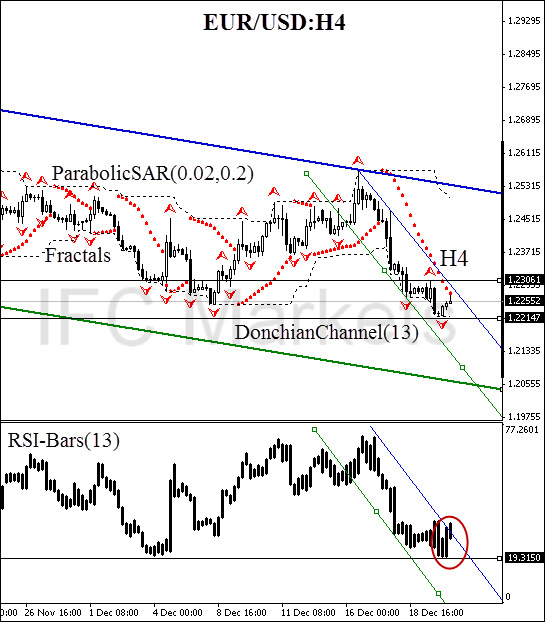
| Position | Sell |
| Sell stop | below 1.22147 |
| Stop loss | above 1.23061 |
Dear traders. For the detailed report of the strategy based on analytical issues of technical analysis click here.
- Get Certificate

Note:
This overview has an informative and tutorial character and is published for free. All the data, included in the overview, are received from public sources, recognized as more or less reliable. Moreover, there is no guarantee that the indicated information is full and precise. Overviews are not updated. The whole information in each overview, including opinion, indicators, charts and anything else, is provided only for familiarization purposes and is not financial advice or а recommendation. The whole text and its any part, as well as the charts cannot be considered as an offer to make a deal with any asset. IFC Markets and its employees under any circumstances are not liable for any action taken by someone else during or after reading the overview.
