- Analytics
- Technical Analysis
EUR USD Technical Analysis - EUR USD Trading: 2015-02-24
ECB and Fed can shift markets
The heads of leading central banks of the world will be delivering their speeches today. The ECB President Mario Draghi is due to speak in Frankfurt at 14:00 CET. At 15:00 CET the Fed Chair Janet Yellen will testify before the US Senate Banking Committee. Investors expect that Draghi will confirm the dates and the amount of targeted longer-term refinancing operations (TLTRO) announced last year. Recall that it is planned to start this March in the monthly amount of 60 billion euro. Market participants expect Janet Yellen to shed light on the timing of the rate hike in the United States. Previously, it was supposed to happen in April 2015. However, FOMC Meeting Minutes released last Wednesday revealed that an early rate hike was doubtful: the world economy is being in a poor state for the first time since January 2013. In general, we consider the situation to be ambiguous. The US dollar index has been traded sideways for a month. As a rule, after leaving this trend, strong movement is expected further on. The statements made by the heads of the ECB and the Fed will probably guide the exchange rate in some direction. Unfortunately, the trend is difficult to predict in advance.
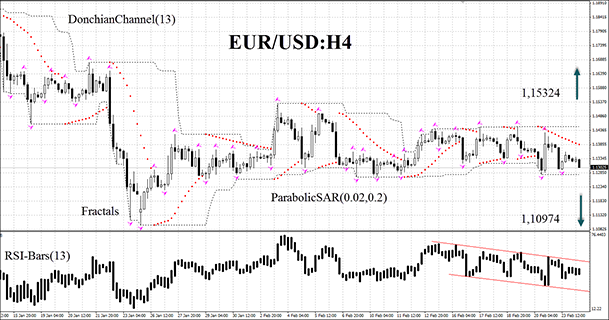
Let’s consider the EUR/USD currency pair on the H4 chart. It was traded sideways on January 26, 2015. The last bars of RSI-Bars are below 50 and form a downtrend. But as we noted above, the final price direction of this currency pair will depend on the monetary policy determined by the Fed and the ECB. We believe a new trend will appear after sideways trading is finished. Let the market choose the price direction. The most significant levels at 1.10974 and 1.15321 are confirmed by Bill Williams fractals and Donchian Channel boundaries. Two positions can be placed at the opposite levels: after one of the orders is opened, the second one can be deleted. It means the market has chosen the direction. After pending order activation, Stop loss is to be moved every four hours near the next fractal high (short position) or low (long position), following Parabolic values. Thus, we are changing the probable profit/loss ratio to the breakeven point.
| Position | Sell |
| Sell stop | below 1.10974 |
| Stop loss | above 1.15321 |
| Position | Buy |
| Buy stop | above 1.15321 |
| Stop loss | below 1.10974 |
Dear traders. For the detailed report of the strategy based on analytical issues of technical analysis click here.
- Get Certificate

Note:
This overview has an informative and tutorial character and is published for free. All the data, included in the overview, are received from public sources, recognized as more or less reliable. Moreover, there is no guarantee that the indicated information is full and precise. Overviews are not updated. The whole information in each overview, including opinion, indicators, charts and anything else, is provided only for familiarization purposes and is not financial advice or а recommendation. The whole text and its any part, as well as the charts cannot be considered as an offer to make a deal with any asset. IFC Markets and its employees under any circumstances are not liable for any action taken by someone else during or after reading the overview.
