- Analytics
- Technical Analysis
EUR USD Technical Analysis - EUR USD Trading: 2015-03-31
Flat continues til Friday
Growing unemployment in February has been reported today in the EU. Deflation in March slipped but kept on track, driving the euro down. However, we believe that until the Friday Non-Farm Payrolls the common currency will be traded in a range. A number of important macroeconomic indices will be released in the US today: Chicago Purchasing Manager at 15:45 CET and Consumer Confidence at 16:00 CET. The tentative outlook is slightly positive for the American dollar.
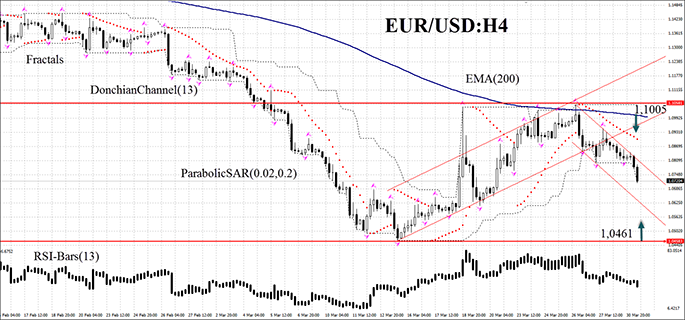
The EUR/USD currency pair escaped the down-trend on the H4 chart and is now traded in a range: 1.1052 – 1.0461. The curve is a little bit below the corridor center and is moving towards the lower boundary. Thus, we do not rule out that until Friday the pair will reach the top or the bottom and rebound back to the middle. If RSI-Bars touches the overbought or the oversold zone that may confirm our assumptions. A sell order may be placed at the moving average – 1.1005. Stop loss may be placed at the Donchian Channel upper boundary and at the local fractal high – 1.1052. A buy order may be located at the flat corridor's bottom – 1.0461 with a stop loss slightly below (at 1.0431 for example). After pending order activation stop loss is to be moved every 4 hours near the next fractal, following Parabolic signals. Thus, we are changing the probable profit/loss ratio to the breakeven point. If the price meets stop loss level without reaching the order, we recommend cancelling the position: market sustains internal changes that were not considered.
| Position | Sell |
| Sell limit | above 1,1005 |
| Stop loss | above 1,1052 |
| Position | Buy |
| Buy limit | below 1,0461 |
| Stop loss | below 1,0431 |
- Get Certificate

Note:
This overview has an informative and tutorial character and is published for free. All the data, included in the overview, are received from public sources, recognized as more or less reliable. Moreover, there is no guarantee that the indicated information is full and precise. Overviews are not updated. The whole information in each overview, including opinion, indicators, charts and anything else, is provided only for familiarization purposes and is not financial advice or а recommendation. The whole text and its any part, as well as the charts cannot be considered as an offer to make a deal with any asset. IFC Markets and its employees under any circumstances are not liable for any action taken by someone else during or after reading the overview.
