- Analytics
- Technical Analysis
EUR USD Technical Analysis - EUR USD Trading: 2015-04-13
Trend persistence
Let’s examine the EUR/USD currency pair on the daily chart. The price is moving inside the W1 and D1 downtrend channels: bearish trends coincide. Note the price pattern formation called “double top”, which is strengthened by the candlestick pattern absorption (marked in yellow). The chart pattern confirms the resistance level at 1.10651, which can be used for placing Stop loss when you go short. ParabolicSAR trend indicator finished the bearish reversal: its points are moving along the daily trend line, confirming its strength. Also note the negative bias of the Donchian Channel. RSI-Bars oscillator indicates the trend line breakout after the consolidation inside the triangle, which can be considered as an early sign of the bearish market.
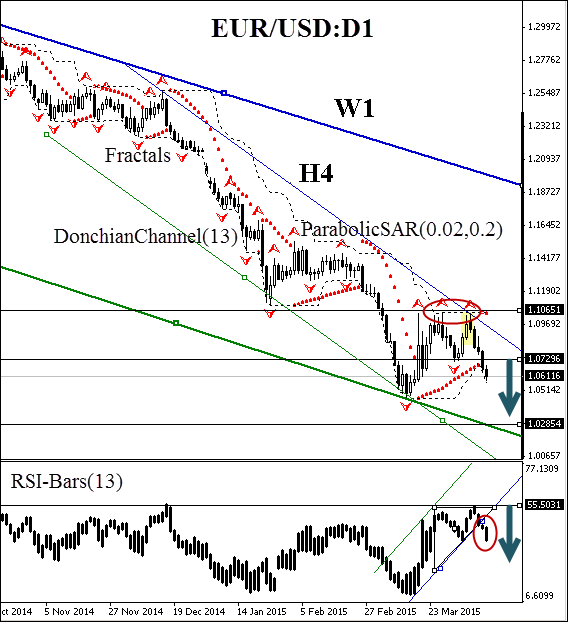
The fractal support level at 1.07296 was successfully broken by the price. It means you can go short straight away. The breakout is significant as it was followed by Parabolic reversal and crossing the RSI-Bars trend line. After the order placing, Stop loss is to be moved every day at the next fractal high, following Parabolic signals. Thus, we are changing the probable profit/loss ratio to the breakeven point.
| Position | Sell |
| Stop loss | above 1.10651 |
- Get Certificate

Note:
This overview has an informative and tutorial character and is published for free. All the data, included in the overview, are received from public sources, recognized as more or less reliable. Moreover, there is no guarantee that the indicated information is full and precise. Overviews are not updated. The whole information in each overview, including opinion, indicators, charts and anything else, is provided only for familiarization purposes and is not financial advice or а recommendation. The whole text and its any part, as well as the charts cannot be considered as an offer to make a deal with any asset. IFC Markets and its employees under any circumstances are not liable for any action taken by someone else during or after reading the overview.
