- Analytics
- Technical Analysis
GB 100 Index Technical Analysis - GB 100 Index Trading: 2016-11-15
British stocks fall together with commodities
British FTSE 100 is pushed lower by falling commodities and energy prices. Oil and gas sector accounts for 22% of the index while commodities account for 13%. Will FTSE 100 continue falling?
Falling stocks of UK companies which have much of their business located in developing countries are additional negative for British indices. Majority of stock indices in developing countries fell as investors expect the new US president Donald Trump to bring in new protectionist measures to support US industry and transfer production back to US. British commodity and defense stocks slumped on Monday. As a rule, they make steady dividend payments and are viewed by investors as alternative to bonds. At present, markets are concerned with rising inflation in UK in the aftermath of Brexit. 10-year treasuries are traded lower which pushed up their yields to record high in recent 6 months. British trade balance is constantly negative of about -12bn pounds per month. Quarterly current account balance is negative of almost -30bn pounds a quarter. This may be negative for countries economy. On Tuesday at 10-30 СЕТ the negative consumer price index for October 2016 came out in UK.
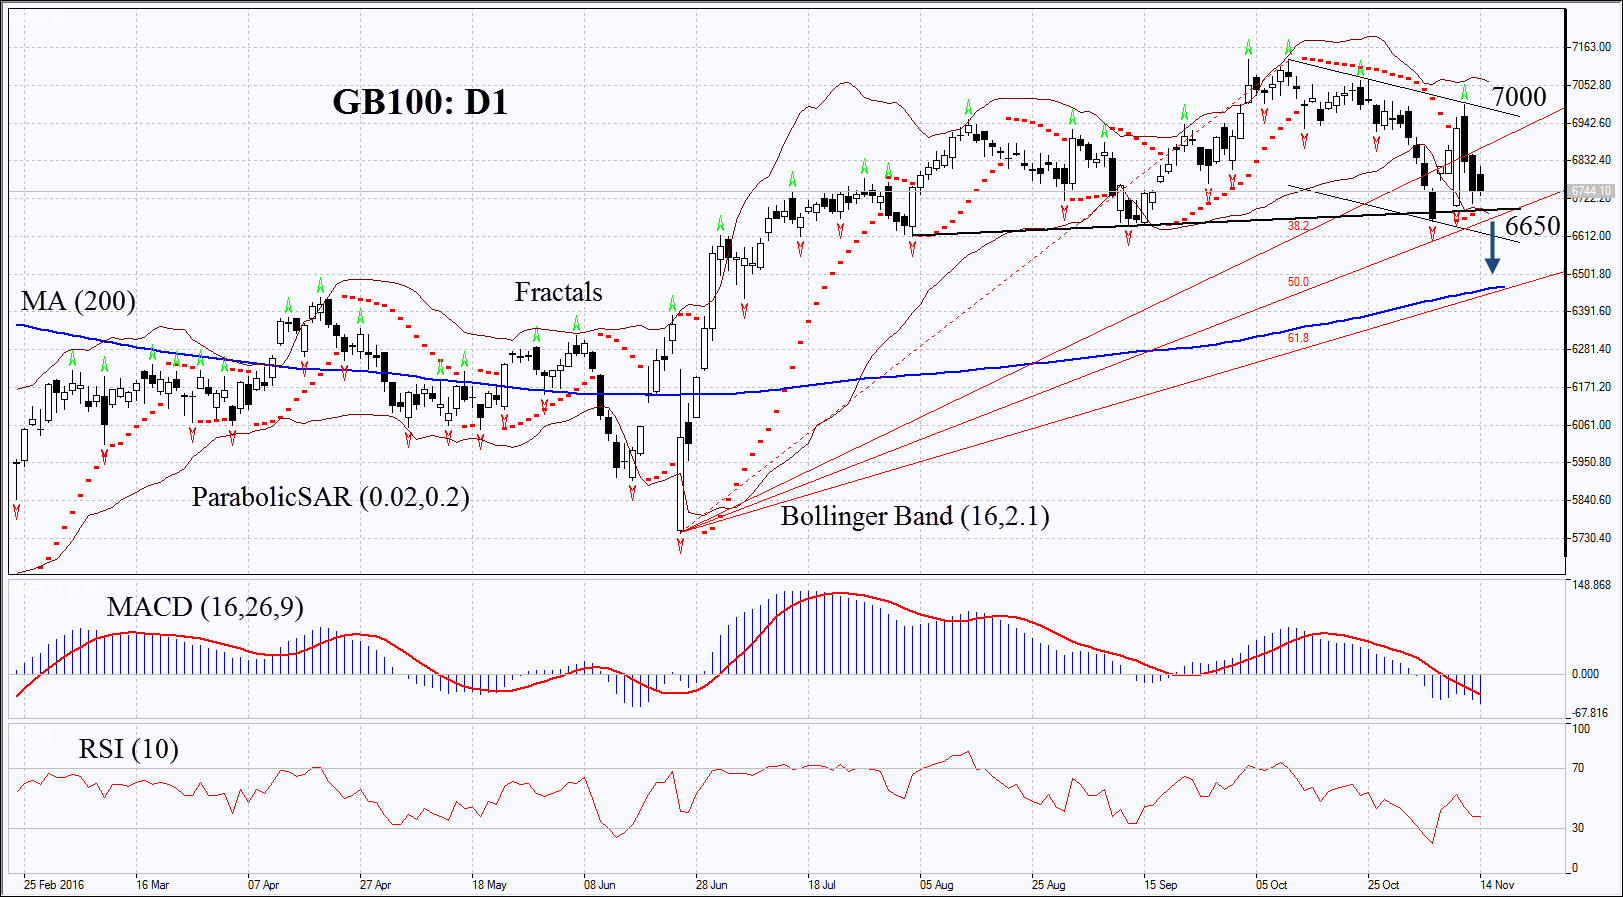
On the daily chart GB100: D1 is correcting down within the descending channel. Further decline is possible in case of weak economic indicators in UK and lower global commodity prices.
- Parabolic gives bullish signals. It may serve as additional support which is to be broken down.
- Bollinger bands have widened which means higher volatility. They are tilted downward.
- RSI is below 50 but is far from the oversold zone, no divergence.
- MACD gives bearish signals.
The bearish momentum may develop in case GB100 falls below the two last fractal lows, Parabolic signal and Gann line at 6650. This level may serve the point of entry. The initial stop-loss may be placed above the Parabolic signal and the last fractal high at 7000. Having opened the pending order we shall move the stop to the next fractal high following the Parabolic and Bollinger signals. Thus, we are changing the probable profit/loss ratio to the breakeven point. The most risk-averse traders may switch to the 4-hour chart after the trade and place there a stop-loss moving it in the direction of the trade. If the price meets the stop-loss level at 7000 without reaching the order at 6650, we recommend cancelling the position: the market sustains internal changes which were not taken into account.
Summary of technical analysis
| Position | Sell |
| Sell stop | below 6650 |
| Stop loss | above 7000 |
- Get Certificate

Note:
This overview has an informative and tutorial character and is published for free. All the data, included in the overview, are received from public sources, recognized as more or less reliable. Moreover, there is no guarantee that the indicated information is full and precise. Overviews are not updated. The whole information in each overview, including opinion, indicators, charts and anything else, is provided only for familiarization purposes and is not financial advice or а recommendation. The whole text and its any part, as well as the charts cannot be considered as an offer to make a deal with any asset. IFC Markets and its employees under any circumstances are not liable for any action taken by someone else during or after reading the overview.
