- Analytics
- Technical Analysis
GBP USD Technical Analysis - GBP USD Trading: 2014-10-23
Pending British pound
Today we consider the daily chart of GBP/USD currency pair. The price is going down within the daily and weekly downtrend channel. There was a breakout of the daily trend line, but we assume it to be false: at the moment the price went back to the trend line. The downtrend price movement is confirmed by the DonchianChannel bias. Let us consider the RSI-Bars oscillator chart: we can observe that the triangle was formed. That means the market is waiting for further action and has not decided yet on the direction. The triangle top side was breached, and that gives us a warning about a possible change in the current price trend. In order to get an additional confirmatory bearish signal, we may wait for the oscillator level breakout at 29.5458%. It will happen before Parabolic trend indicator gives us a signal by crossing the price level at 1.5869. This mark can be used for placing a pending sell order. It is reinforced with the DonchianChannel lower boundary, Parabolic historical values and Bill Williams fractal. Stop Loss is recommended to be placed at the high of 1.6233. Its significance is confirmed by the fractal and Parabolic values.
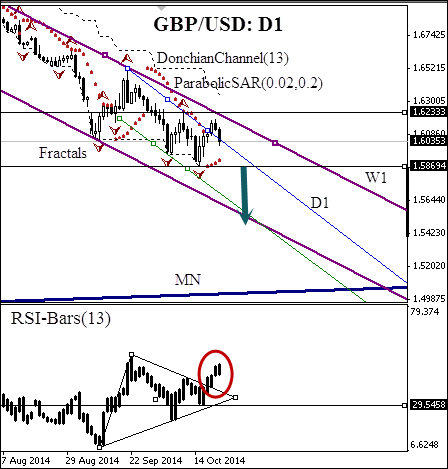
After position opening, Trailing Stop is to be moved after the Parabolic values, near the next fractal peak. Updating is enough to be done every day after a new Bill Williams fractal formation (5 candlesticks). Thus, we are changing the probable profit/loss ratio to the breakeven point.
| Position | Sell |
| Sell stop | below 1.5869 |
| Stop loss | above 1.6233 |
Dear traders. You can see the detailed report of the author’s account by clicking here.
- Get Certificate

Note:
This overview has an informative and tutorial character and is published for free. All the data, included in the overview, are received from public sources, recognized as more or less reliable. Moreover, there is no guarantee that the indicated information is full and precise. Overviews are not updated. The whole information in each overview, including opinion, indicators, charts and anything else, is provided only for familiarization purposes and is not financial advice or а recommendation. The whole text and its any part, as well as the charts cannot be considered as an offer to make a deal with any asset. IFC Markets and its employees under any circumstances are not liable for any action taken by someone else during or after reading the overview.
