- Analytics
- Technical Analysis
Grain Commodities Technical Analysis - Grain Commodities Trading: 2017-02-20
Better crops outlook
In this report we suggest studying the personal composite instrument (PCI) grain index. It includes four major grains traded at stock exchange. The index may decline in case the single CFDs, its constituents, fall in price.
Previously grains reached the 8-month high on rising global demand rose and negative crops outlook. In particular, market participants were worried that winter wheat sowings may be harmed in EU due to cold and dry winter. Now the news is changing.
FranceAgriMer Agency released on Friday the data on wheat sowings in France which is the European leader by its production. The share of sowings rated “good and excellent” is 92%. This is below the last year level of 94% but much better than expected. Russian Ministry of Agriculture forecasts that national wheat crops in 2017 will be roughly in line with the record crops of 2016 of 119mln tonnes. Russia ranks 3rd in the world by wheat production and, speaking of export, shares the 1st place with the US. Excellent soybeans crops are anticipated in Brazil. Meanwhile, soybean oil prices fell in India to their 2-year low as national production increased by far. Mexico decided to diversify the import shipments of corn and is planning to buy it in South Africa. Previously almost all needed corn had been purchased in the US but now Mexico decided to undertake the counter-moves after the US tightened the US migration policy and on Trump’s comments. The cancellation of purchases may negatively affect the US agriculture and push prices down.
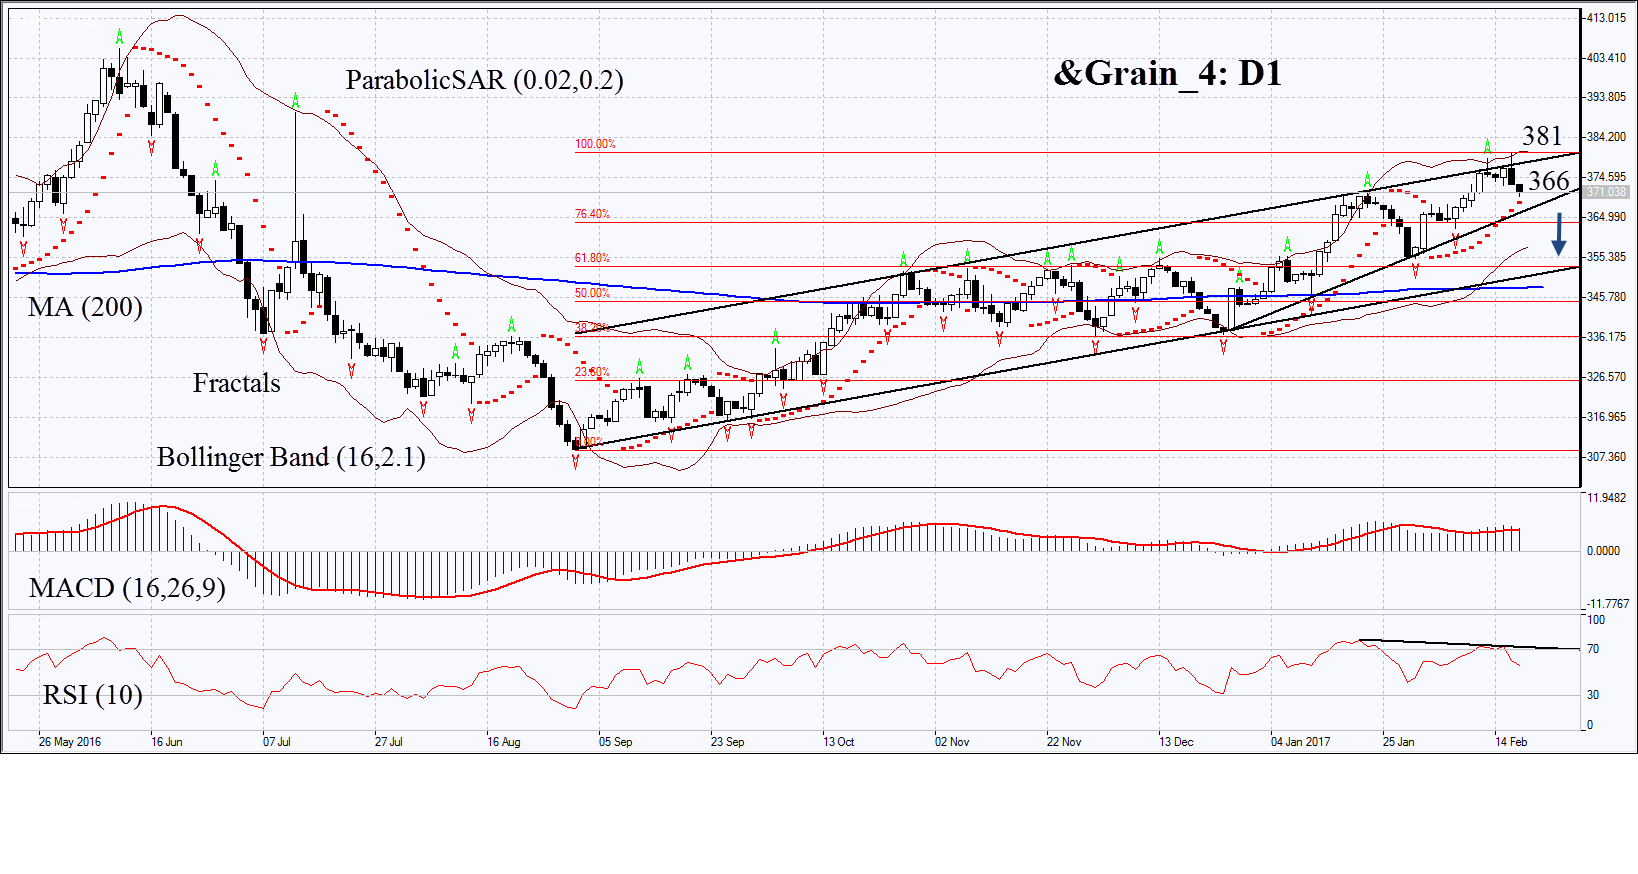
On the daily chart &Grain_4: D1 has advanced to the upper boundary of the rising channel having hit a fresh 8-month high. Now it is struggling for downward correction. Its further decline is possible in case grain crops rise.
- The Parabolic indicator is giving bullish signal. It may serve the additional level of support which the chart has to break down through to open short position.
- The Bollinger bands have narrowed which means lower volatility.
- The RSI is above 50. It has formed negative divergence.
- The MACD is giving bearish signals.
The bearish momentum may develop in case &Grain_4 falls below the Parabolic signal and the support of the short-term trend at 366. This level may serve the point of entry. The initial stop-loss may be placed above the last fractal high, the 8-month high, the Bollinger band and the upper boundary of the rising trend at 381. Having opened the pending order we shall move the stop to the next fractal high following the Parabolic and Bollinger signals. Thus, we are changing the probable profit/loss ratio to the breakeven point. The most risk-averse traders may switch to the 4-hour chart after the trade and place there a stop-loss moving it in the direction of the trade. If the price meets the stop-loss level at 381 without reaching the order at 366, we recommend cancelling the position: the market sustains internal changes which were not taken into account.
Summary of technical analysis
| Position | Sell |
| Sell stop | below 366 |
| Stop loss | above 381 |
- Get Certificate

Note:
This overview has an informative and tutorial character and is published for free. All the data, included in the overview, are received from public sources, recognized as more or less reliable. Moreover, there is no guarantee that the indicated information is full and precise. Overviews are not updated. The whole information in each overview, including opinion, indicators, charts and anything else, is provided only for familiarization purposes and is not financial advice or а recommendation. The whole text and its any part, as well as the charts cannot be considered as an offer to make a deal with any asset. IFC Markets and its employees under any circumstances are not liable for any action taken by someone else during or after reading the overview.
