- Analytics
- Technical Analysis
Nikkei Index Technical Analysis - Nikkei Index Trading: 2015-09-28
Japanese stock market: looming deflation
The Japanese economy is falling back into deflation: in August the Consumer Price Index lowered 0.1% annualized. Does the slowing economy favour the negative scenarios for the stock market?
For the last three years the Japan’s GDP growth has been around 1%. Compared with the pre-crisis growth of 3-4% a year this trend may weaken if not stagnate. In such a case, the weaker inflation is natural. Even the moderate energy prices do not stimulate the weak consumer demand any longer. The demand is falling not least because of the ageing population, decreasing productivity and the increasing fiscal burden on business to sponsor the social expenditures. The situation is partly under control due to the loose monetary policy. For instance, the Bank of Japan left the key interest rate unchanged at the minimal 0-0.1% on September 15, 2015 going on with financing businesses. Nevertheless, the investors are pessimistic as the available monetary stimulus is worked out and the slowdown of the Chinese economy, the nearest trade partner, affects the Japanese exporters. This results in a bearish trend for NIKKEI stock index.
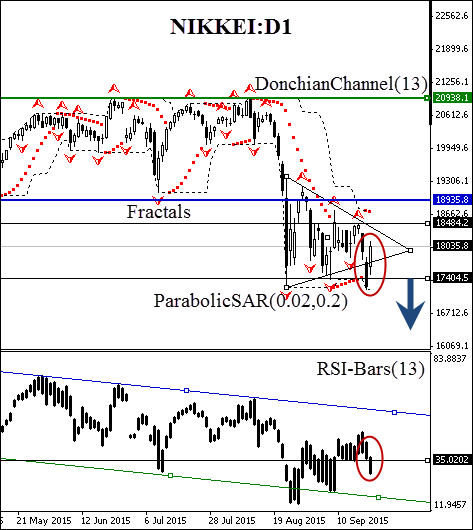
Let’s have a look at its daily chart. On the new rate the price has broken down through the support at 18935.8, leaving the channel after several weeks of staying within it. Last week ahead of the Janet Yellen speech the triangle was formed and then broken after the press conference. The lower side of the triangle is supported by the Donchian channel and is broken out to the downside (the red ellipse) together with the oscillator support of 35%. The latest bearish signal is the trend indicator Parabolic reversal. The risk-averse traders may wait for the second breakout at 17404.5. At this level the pending order to sell may be formed. The risk limits shall be fixed at the opposite verge of the Donchian channel at 18484.2. This level is supported by the weekly Bill Williams’ fractal. The stop loss shall be moved to the next fractal high every day following the Parabolic signal. Thus, we adjust the potential profit/loss ratio to the breakeven point.
| Position | Sell |
| Sell stop | below 17404.5 |
| Stop loss | above 18484.2 |
- Get Certificate

Note:
This overview has an informative and tutorial character and is published for free. All the data, included in the overview, are received from public sources, recognized as more or less reliable. Moreover, there is no guarantee that the indicated information is full and precise. Overviews are not updated. The whole information in each overview, including opinion, indicators, charts and anything else, is provided only for familiarization purposes and is not financial advice or а recommendation. The whole text and its any part, as well as the charts cannot be considered as an offer to make a deal with any asset. IFC Markets and its employees under any circumstances are not liable for any action taken by someone else during or after reading the overview.
