- Analytics
- Technical Analysis
NZD USD Technical Analysis - NZD USD Trading: 2015-06-26
Trend continues
Let us consider the NZD/USD currency pair on the daily time frame. The price has been moving within the daily and the weekly trend with a bearish slope. Parabolic historical values and the Donchian Channel upper boundary confirm the trend. At the moment we observe consolidation inside the range from 0.68108 to 0.70136. The correction is shown by the RSI-Bars oscillator, which has turned upwards.
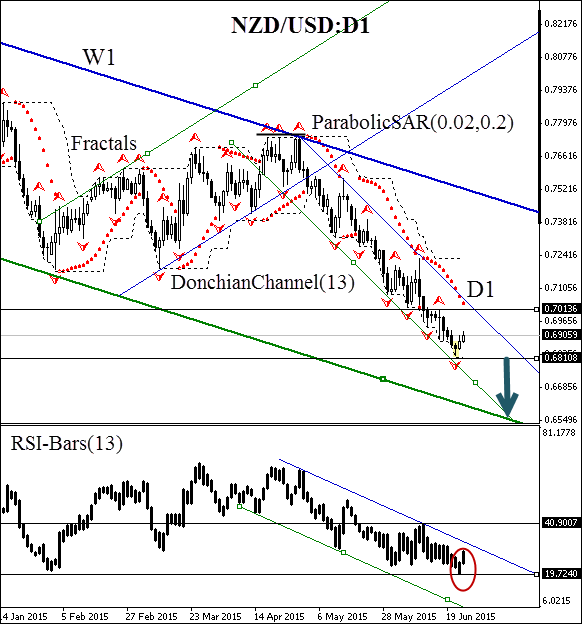
We believe that all the represented analysis tools give bearish signals. The terminal impulse is expected after breaching the essential support line at 19%. The mark corresponds to the Donchian lower boundary and the fractal ay 0.68108. A sell pending order may be placed there. A stop loss may be placed at the channel opposite boundary (0.70136). The level is assured by Parabolic historical signals and the trend line. The further bearish momentum should be confirmed by breaking out the oscillator support at 19%. Conservative traders are recommended to monitor this signal. The stop loss is supposed to be moved every day to the next fractal maximum, following Parabolic signals. Thus, we are changing the probable profit/loss ratio to the breakeven point.
| Position | Sell |
| Sell stop | below 0.68108 |
| Stop loss | above 0.70136 |
- Get Certificate

Note:
This overview has an informative and tutorial character and is published for free. All the data, included in the overview, are received from public sources, recognized as more or less reliable. Moreover, there is no guarantee that the indicated information is full and precise. Overviews are not updated. The whole information in each overview, including opinion, indicators, charts and anything else, is provided only for familiarization purposes and is not financial advice or а recommendation. The whole text and its any part, as well as the charts cannot be considered as an offer to make a deal with any asset. IFC Markets and its employees under any circumstances are not liable for any action taken by someone else during or after reading the overview.
