- Analytics
- Technical Analysis
NZD USD Technical Analysis - NZD USD Trading: 2015-07-23
New Zealand Trade Balance
Let us consider the NZD/USD currency pair on the daily chart. We observe a bearish trend caused by the expected negative Trade Balance to be released in New Zealnd on Friday. The price approached the weekly support line at 0.64917, which is confirmed by Bill Williams fractal. At the moment the instrument is rebounding towards the green zone, which is assured by the double bottom pattern, formed by the RSI-Bars oscillator. The signal breached the trend line and shaped a bullish reversal pattern. The movement can be considered confirmed if the price crosses the support at 0.67743, which will launch Donchian Channel and Parabolic towards the green zone.
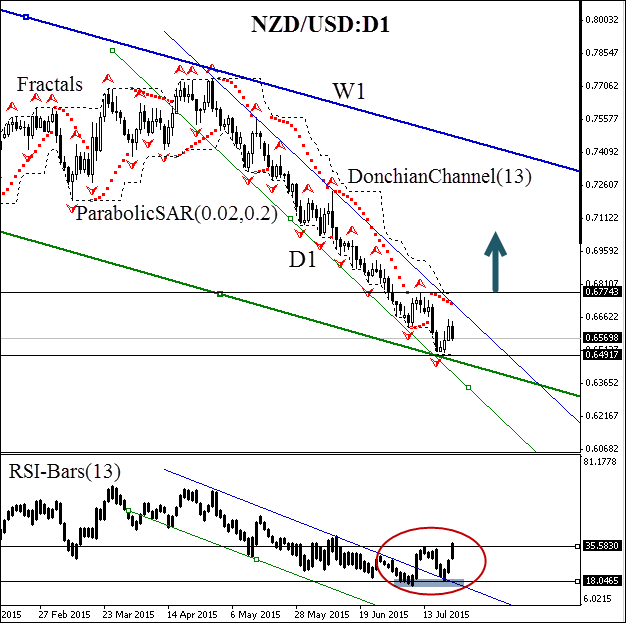
A sell pending order can be placed at this mark. A stop loss may be placed on the Donchian Channel opposite boundary at 0.64917. This level is supported by the weekly support line and Bill Williams fractal. The stop order is supposed to be moved every four hours to the next fractal low, following Parabolic signals. Thus, we are changing the probable profit/loss ratio to the breakeven point.
| Position | Buy |
| Buy stop | above 0.67743 |
| Stop loss | below 0.64917 |
- Get Certificate

Note:
This overview has an informative and tutorial character and is published for free. All the data, included in the overview, are received from public sources, recognized as more or less reliable. Moreover, there is no guarantee that the indicated information is full and precise. Overviews are not updated. The whole information in each overview, including opinion, indicators, charts and anything else, is provided only for familiarization purposes and is not financial advice or а recommendation. The whole text and its any part, as well as the charts cannot be considered as an offer to make a deal with any asset. IFC Markets and its employees under any circumstances are not liable for any action taken by someone else during or after reading the overview.
