- Analytics
- Technical Analysis
WTI Crude Technical Analysis - WTI Crude Trading: 2015-04-16
WTI hits one-year high
Today we examine the price activity of Commodity CFD (WTI). It is traded as OIL in NetTradeX treminal. Crude oil prices soared on Wednesday and both WTI and Brent hit new one-year highs. WTI finished sideways trading, which lasted for three months, with an upsurge. It will be possibly followed by Brent. The price hike was caused by the following factors. OPEC released the monthly report, where the forecast for oil output in 2015 in countries outside the cartel was cut down to 680 thousand barrels a day, from 840 thousand. The US crude oil reserves of the past week showed a slight growth in the current year amid the imports reduction. It amounted to 1.3 million barrels, while oil reserves were expected to rise up to 4.1 million. At the same time, oil production in the US dropped for the second time over the last three weeks. Market participants are concerned over the persistence of such a negative trend ahead of the summer driving season, when, as a rule, the demand for gasoline is higher. According to U.S. Energy Information Administration, oil production in the US will fall down from 10 million barrels a day in March to 9.37 million in April and May, and even lower to 9.04 million in September. We deem that this may be a result of the reduced number of oil rigs (fallen by 50%) from their top number in last October. As world prices were falling, oil companies halted the operation of some oil rigs to reduce costs.
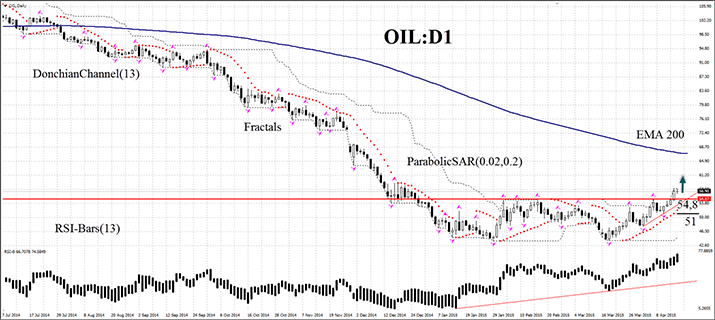
OIL instrument has finished sideways trading on the D1 chart and started to advance, hitting one year low. RSI oscillator’s last bar approached the overbought zone, which doesn’t exclude a further upturn. In our opinion, you may go long immediately. Conservative investors may wait for OIL return to the resistance line of the previous price range, which is currently the support line at 54.8. However, there is a risk to loose the movement if the price isn’t falling down to this level. Stop loss is to be placed at the last fractal low and Parabolic point at 51. After the pending order placing, Stop loss is to be moved every day at the next fractal low, following Parabolic and Donchian Channel signals. Thus, we are changing the probable profit/loss ratio to the breakeven point. If the price meets Stop loss level without reaching the order, we recommend cancelling the position: market sustains internal changes which were not considered.
| Position | Buy |
| Buy limit | above 54.8 |
| Stop loss | below 51 |
- Get Certificate

Note:
This overview has an informative and tutorial character and is published for free. All the data, included in the overview, are received from public sources, recognized as more or less reliable. Moreover, there is no guarantee that the indicated information is full and precise. Overviews are not updated. The whole information in each overview, including opinion, indicators, charts and anything else, is provided only for familiarization purposes and is not financial advice or а recommendation. The whole text and its any part, as well as the charts cannot be considered as an offer to make a deal with any asset. IFC Markets and its employees under any circumstances are not liable for any action taken by someone else during or after reading the overview.
