- Analytics
- Technical Analysis
Technical Analysis - Trading: 2015-03-04
Reduced spread
Today we would like to focus your attention to the Personal Composite Instrument (PCI) &Brent_WTI on the H4 chart. The instrument reflects price movements of a portfolio composed of two oil futures: Brent in the base part and WTI in the quoted part. In fact, this PCI is a price spread between European and American oil. As widely known, oil prices started to slide in the middle of last year and it was caused by a sharp rise in US shale oil production, meanwhile the production in other regions of the world was maintained at the same pace. WTI was sagging lower much faster than Brent. Earlier this year &Brent_WTI has soared, reflecting the oil trends. The spread between the two types of crude oil increased greatly from its historical values. As there is little difference between them, we don’t exclude reducing of the price spread and PCI sliding. You can import &Brent_WTI PCI into NetTradeX from our website.
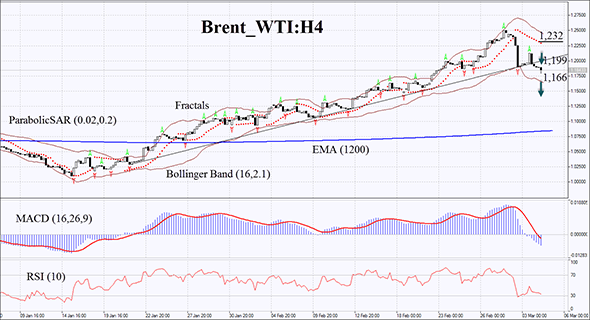
&Brent_WTI broke the uptrend support level on the H4 chart. Bollinger bands have already started to widen, but the price has not reached the lower band yet. Note the reduced volatility on the MACD chart: it is below the zero level and the signal line which can be considered a bearish signal. The RSI indicator is going down, but hasn’t reached the oversold level yet. We do not rule out the bearish momentum being developed after the last &Brent_WTI candlestick will close below the lower Bollinger band, which is currently the level at 1.166. Another entry point may be considered the previous uptrend line which acts as the resistance line. Of course, you should go short in case there is no resistance level breakout at 1.199. Stop loss is to be placed at the last Parabolic point, which can now act as the resistance line at 1.232. After pending order placing, Stop loss is to be moved every four hours near the next fractal high, following Parabolic and Bollinger bands signals. Thus, we are changing the probable profit/loss ratio to the breakeven point. If the price meets stop loss level without reaching the order, we recommend cancelling the position: market sustains internal changes which were not considered.
| Position | Sell |
| Sell stop | below 1.166 |
| Stop loss | above 1.232 |
Dear traders. For the detailed report of the strategy based on analytical issues of technical analysis click here.
- Get Certificate

Note:
This overview has an informative and tutorial character and is published for free. All the data, included in the overview, are received from public sources, recognized as more or less reliable. Moreover, there is no guarantee that the indicated information is full and precise. Overviews are not updated. The whole information in each overview, including opinion, indicators, charts and anything else, is provided only for familiarization purposes and is not financial advice or а recommendation. The whole text and its any part, as well as the charts cannot be considered as an offer to make a deal with any asset. IFC Markets and its employees under any circumstances are not liable for any action taken by someone else during or after reading the overview.
