- Analytics
- Technical Analysis
Retrospective of Technical Analysis #C-RICE From 2016-09-06
Weather affects rice prices

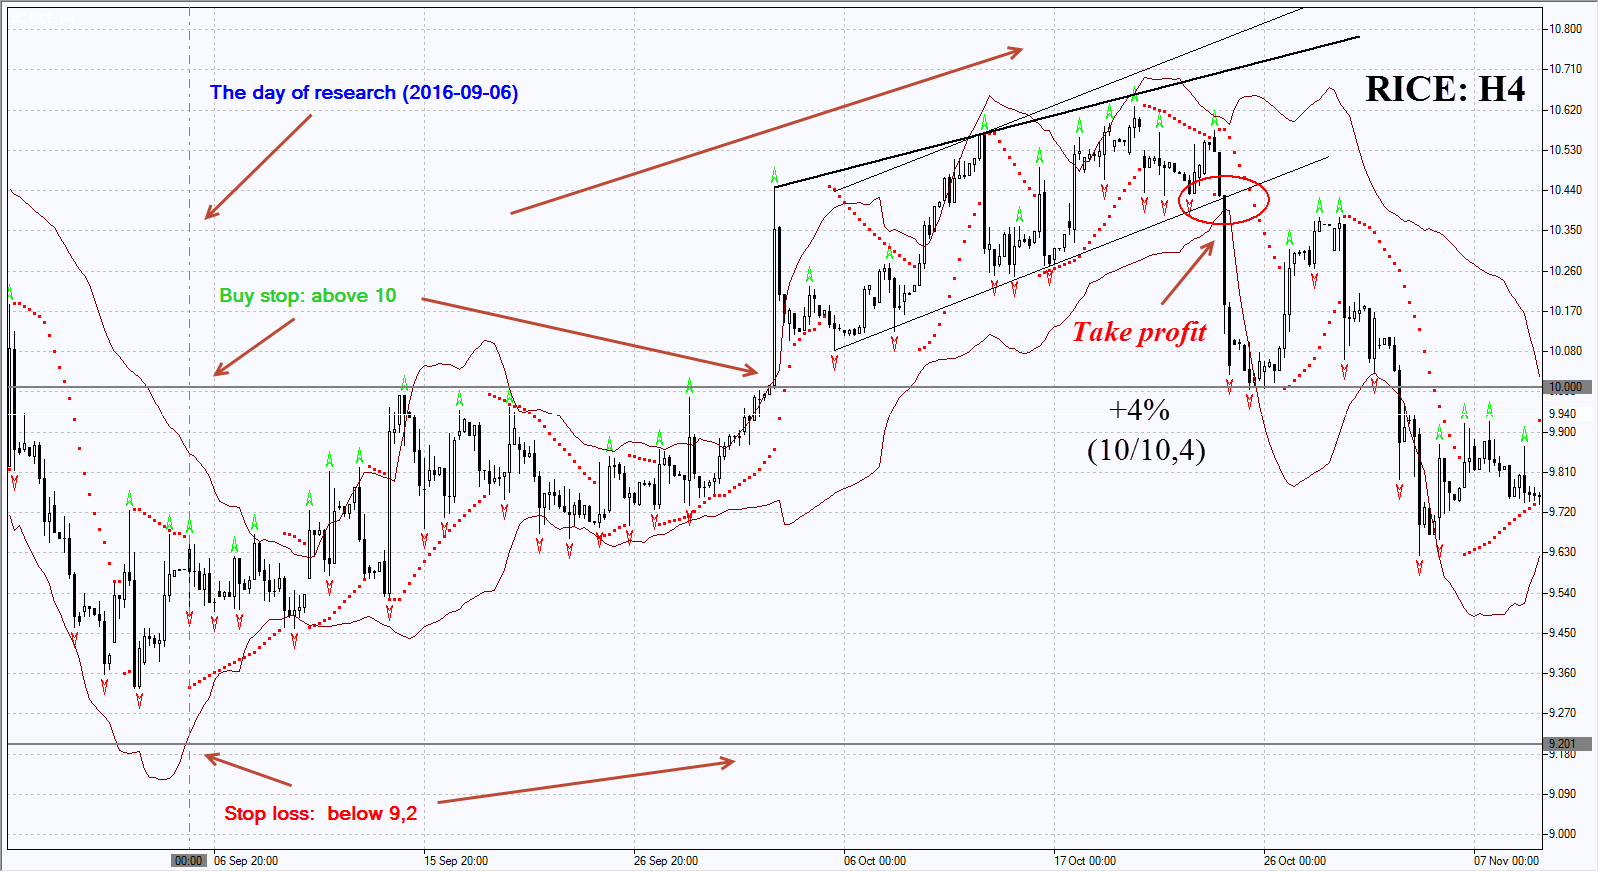
The real price change is depicted on the chart after the techical analysis was released on 2016-09-06. The position was opened with a pending order from the analysis. Then we move the stop following the Bollinger lines and the Parabolic SAR indicators in the 4-hour chart (H4) thus changing the potential profit/loss ratio. The position shall be closed with profit by any of the signals: when the price meets the respective border of Bollinger Bands, Parabolic SAR indications, trend line or the Fractal.
| Buy stop | above 10 |
| Take profit | 10.4 |
| Return on Invetment | +4% |
| Date of Review | 2016-09-06 |
| Date of closing position | 2017-10-24 |
The chart shows the real change of quotations after the publication of technical analysis on 2016-09-06. The pending order from this analysis was executed and the position was opened. Next, we shall move the stop to the next fractal low following the Bollinger Bands and Parabolic SAR signals at the 4-hour charts. Thus, we are changing the potential profit/loss to the breakeven point. The position shall be closed when the price meets the Bollinger bands, the Parabolic SAR, the trend line and the fractal indicator.
New Exclusive Analytical Tool
Any date range - from 1 day to 1 year
Any Trading Group - Forex, Stocks, Indices, etc.
