- Analytics
- Technical Analysis
Rice Investments Technical Analysis - Rice Investments Trading: 2016-11-22
Drought may push rice prices up
Vietnam and Thailand raised the lower boundary of price range for their 5% broken rice from $347 and $345 per tonne to $350 per tonne. Will global rice prices advance?
The volume of global rice market is less than 8% of global rice production. Major producers (China, Indonesia, India, Bangladesh and others) are at the same time the major consumers. India the the world leading exporter as it accounts for 27% of the market with Thailand and Vietnam ranking 2nd and 3rd (18% and 14% of global exports). They are followed by US (10%) and Pakistan (9%). Major rice consumer is China where dietary intake of 65% of population depends on rice. TOP-5 global rice exportes account for 78% of global market. Thus, changes in rice prices in these countries may have a significant effect on soft futures prices. Previously, the Thai officials said there was a lack of water supplies in Lam Takhong water storage. As a possible outcome, farmers from 5 agricultural regions may not be able to harvest 2rd rice crop in current season.
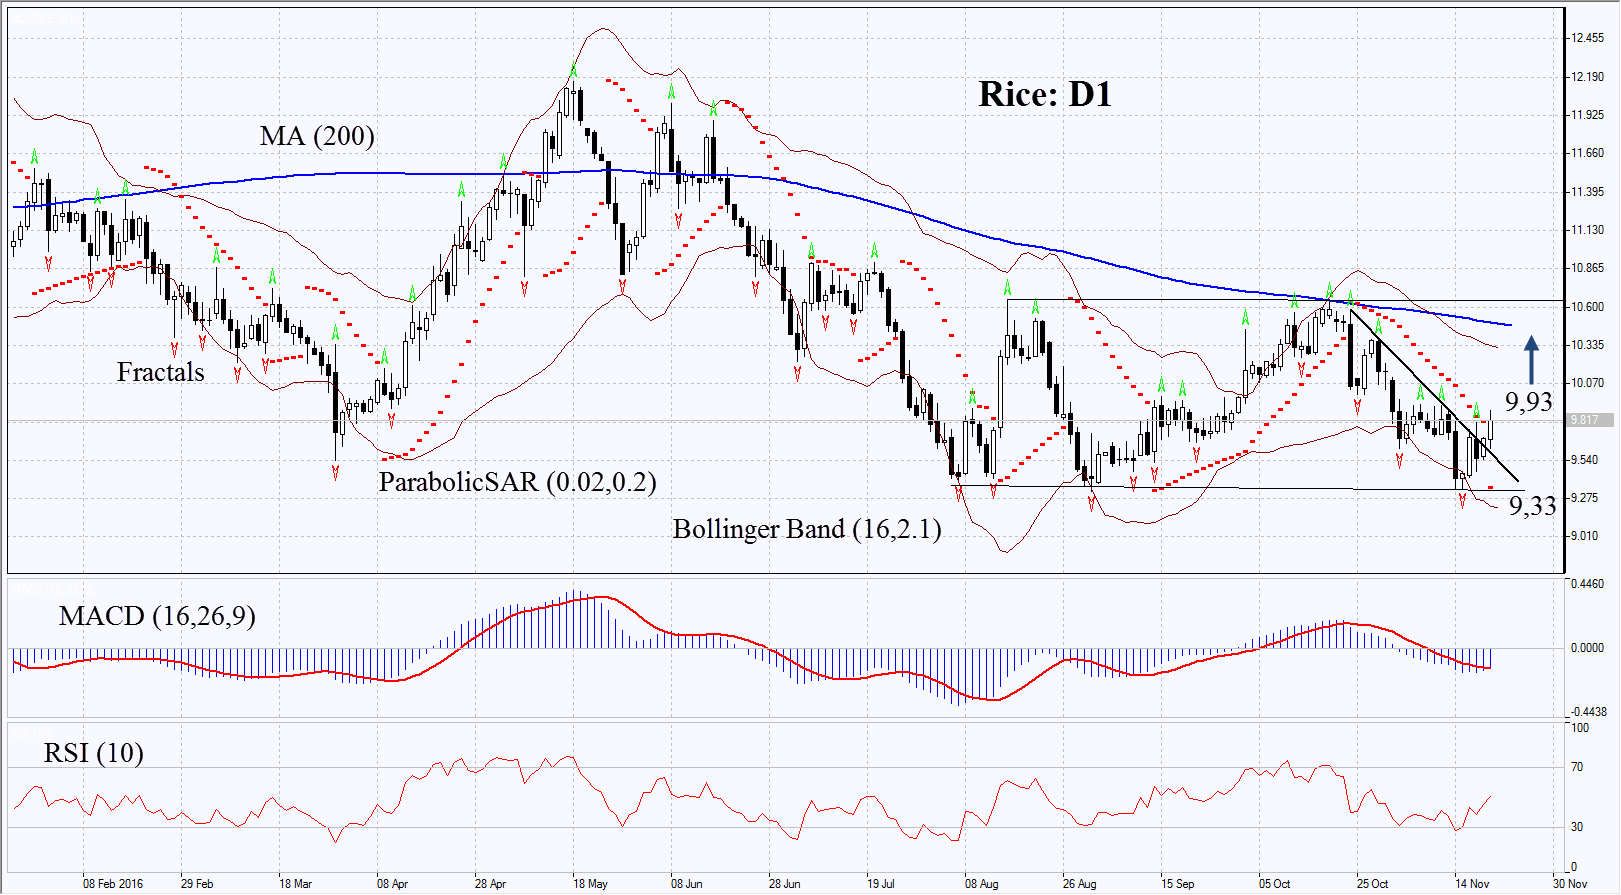
On the daily chart, Rice: D1 has failed to break down throught the support of the sideways channel for yet another time. Now it is correcting towards the upper boundary. Further price increase is possible in case of worse weather conditions in Asian countries.
- Parabolic gives bulish signal.
- Bollinger bands have widened which means higher volatility.
- RSI is above 50, no divergence.
- MACD gives bullish signal.
The bullish momentum may develop in case rice surpasses the three last fractal highs at 9.93. This level may serve the point of entry. The initial stop-loss may be placed below the last fractal low, the support of the neutral trend and the Parabolic signal at 9.33. Having opened the pending order, we shall more the stop to the next fractal low following the Bollinger and Parabolic signals. Thus, we are changing the probable profit/loss ratio to the breakeven point. The most risk-averse traders may switch to the 4-hour chart after the trade and place there a stop-loss moving it in the direction of the trade. If the price meets the stop-loss level at 9.33 without reaching the order at 9.93, we recommend cancelling the position: the market sustains internal changes which were not taken into account.
Summary of techinal analysis
| Position | Buy |
| Buy stop | above 9.93 |
| Stop loss | below 9.33 |
- Get Certificate

Note:
This overview has an informative and tutorial character and is published for free. All the data, included in the overview, are received from public sources, recognized as more or less reliable. Moreover, there is no guarantee that the indicated information is full and precise. Overviews are not updated. The whole information in each overview, including opinion, indicators, charts and anything else, is provided only for familiarization purposes and is not financial advice or а recommendation. The whole text and its any part, as well as the charts cannot be considered as an offer to make a deal with any asset. IFC Markets and its employees under any circumstances are not liable for any action taken by someone else during or after reading the overview.
