- Analytics
- Technical Analysis
Soybean Meal Technical Analysis - Soybean Meal Trading: 2015-04-14
Bearish triangle
Let’s examine the continuous futures on SOYB on the daily chart. The price formed a triangle with a bearish bias. The fractal support at $953 was confirmed twice, but was broken with confidence after the ParabolicSAR reversal. At this moment the bearish bias of the Donchian Channel was formed. However, we deem that it’s still not the time to go short as RSI-Bars oscillator has still not confirmed the breakout, and it may result to be false. The last RSI-bar hasn’t crossed the support level at 29% yet.
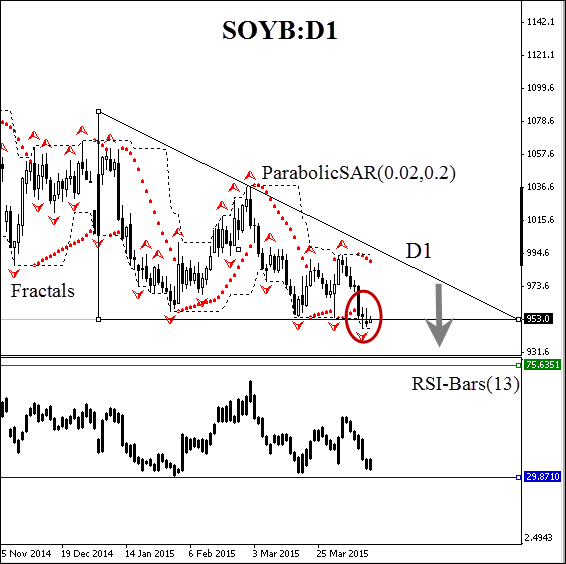
Conservative traders are recommended to wait for the oscillator’s support level to be overcome and immediately open a short position. Stop loss is to be placed near the price resistance level at $994.6. This mark is confirmed by Parabolic historical values, the upper Donchian Channel boundary, and also by one of the triangle sides. After the order placing, Stop loss is to be moved every day at the next fractal high, following Parabolic signals. Thus, we are changing the probable profit/loss ratio to the breakeven point.
| Position | Sell |
| Stop loss | above 994.6 |
- Get Certificate

Note:
This overview has an informative and tutorial character and is published for free. All the data, included in the overview, are received from public sources, recognized as more or less reliable. Moreover, there is no guarantee that the indicated information is full and precise. Overviews are not updated. The whole information in each overview, including opinion, indicators, charts and anything else, is provided only for familiarization purposes and is not financial advice or а recommendation. The whole text and its any part, as well as the charts cannot be considered as an offer to make a deal with any asset. IFC Markets and its employees under any circumstances are not liable for any action taken by someone else during or after reading the overview.
