- Analytics
- Technical Analysis
S&P 500 Technical Analysis - S&P 500 Trading: 2015-04-15
Preparing for triangle leaving
Today we consider the CFD on US stock index S&P 500. It is traded as SP500 in the trading terminal. Currently the US companies listed in the index has opened the Q1 earnings report. According to forecasts, their total income will be reduced by 2.9%. It is much less-than-expected. As for January 1st 2015, market participants have been expecting the total quarterly revenue to grow 5.3%. The index hit a new historical high in February. Amid such weak expectations, S&P 500 has been traded sideways for almost two months. However, in recent days, a number of companies, including JPMorgan Chase, Wells Fargo, Intel, Delta Air Lines and others have published positive reports. Their financial performance outperformed the expectations. Thus, S&P 500 rose close to its historical high again. Note that the US CPI data for March will be published on Friday and it may affect the index dynamics.
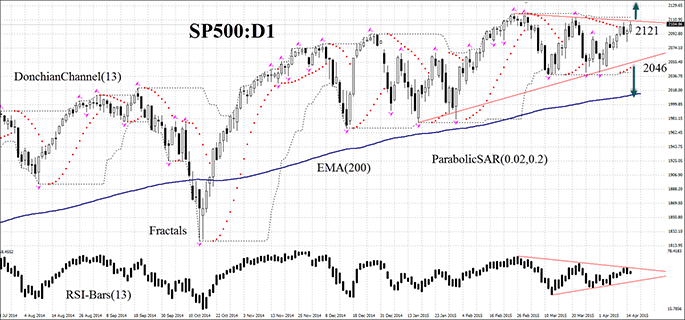
The SP500 instrument indicates the uptrend on the daily chart. The price is located higher than the moving average (200). It formed a triangle and approached its upper boundary, which is also the resistance level at the same time. RSI-Bars oscillator is above the level of 50. The bars also formed a triangle and still have not left it. We don’t rule out a further bullish momentum to be developed when the price breaks the historical high and all the previous fractal upwards, as well as the upper Donchian Channel boundary. A pending buy order can be placed at 2121. Stop loss is to be placed at the lower Donchian Channel boundary and the last local fractal low, which can currently act as the support line at 2039. The most cautious investors may place Stop loss at the lower boundary of the triangle at 2055. In case of negative reporting of the US companies and weak CPI data release, we expect a pullback on the SP500 chart: the price will leave the triangle by moving down. In this case you can place a pending sell order below the support level of the triangle and Parabolic point at 2046. Two positions can be placed in a symmetrical manner: after on of the orders is executed, the second one may be deleted, which means that the market has chosen the price direction. After the pending order placing, Stop loss is to be moved every day at the next fractal high (short position) or fractal low (long position), following Parabolic signals. Thus, we are changing the probable profit/loss ratio to the breakeven point. If the price meets Stop loss level without reaching the order, we recommend cancelling the position: market sustains internal changes which were not considered.
| Position | Sell |
| Sell stop | below 2046 |
| Stop loss | above 2115 |
| Position | Buy |
| Buy stop | above 2121 |
| Stop loss | below 2039 |
- Get Certificate

Note:
This overview has an informative and tutorial character and is published for free. All the data, included in the overview, are received from public sources, recognized as more or less reliable. Moreover, there is no guarantee that the indicated information is full and precise. Overviews are not updated. The whole information in each overview, including opinion, indicators, charts and anything else, is provided only for familiarization purposes and is not financial advice or а recommendation. The whole text and its any part, as well as the charts cannot be considered as an offer to make a deal with any asset. IFC Markets and its employees under any circumstances are not liable for any action taken by someone else during or after reading the overview.
