- Analytics
- Technical Analysis
S&P 500 Technical Analysis - S&P 500 Trading: 2016-11-02
US stocks edge lower on weak data
US stocks dropped on weak corporate earnings data. Additional negative came from higher political risks ahead of presidential elections because of active rivalry of Trump and Clinton. Will US S&P 500 index continue correcting?
Construction spending unexpectedly fell this September by 0.4% which is their record fall in 9 months. Market participants expected the indicator to increase by 0.5%. Thus, construction spending has been falling for 3 straight months. The indicator is inconsistent with US GDP growth in Q3. ISM manufacturing PMI rose in October for 2nd straight month but the positive was compensated for with the falling ISM new orders. US mining and machine-building companies expect 10-20% lower production in October-November because of the hurricanes. Markets price in 78% chances for Fed interest rate hike on December 14, according to FedWatch. Rate hike may raise US corporate credit burden and have negative influence on their financial performance. FBI investigation into the correspondence of Democrat candidate Clinton heightens political risks. Previously the majority of investors considered her to be the favourite of presidential race. Now her preference over Donald Trump may fade. Several important economic indicators and corporate reports will come out till the end of this week. They will affect the US stock market indices.
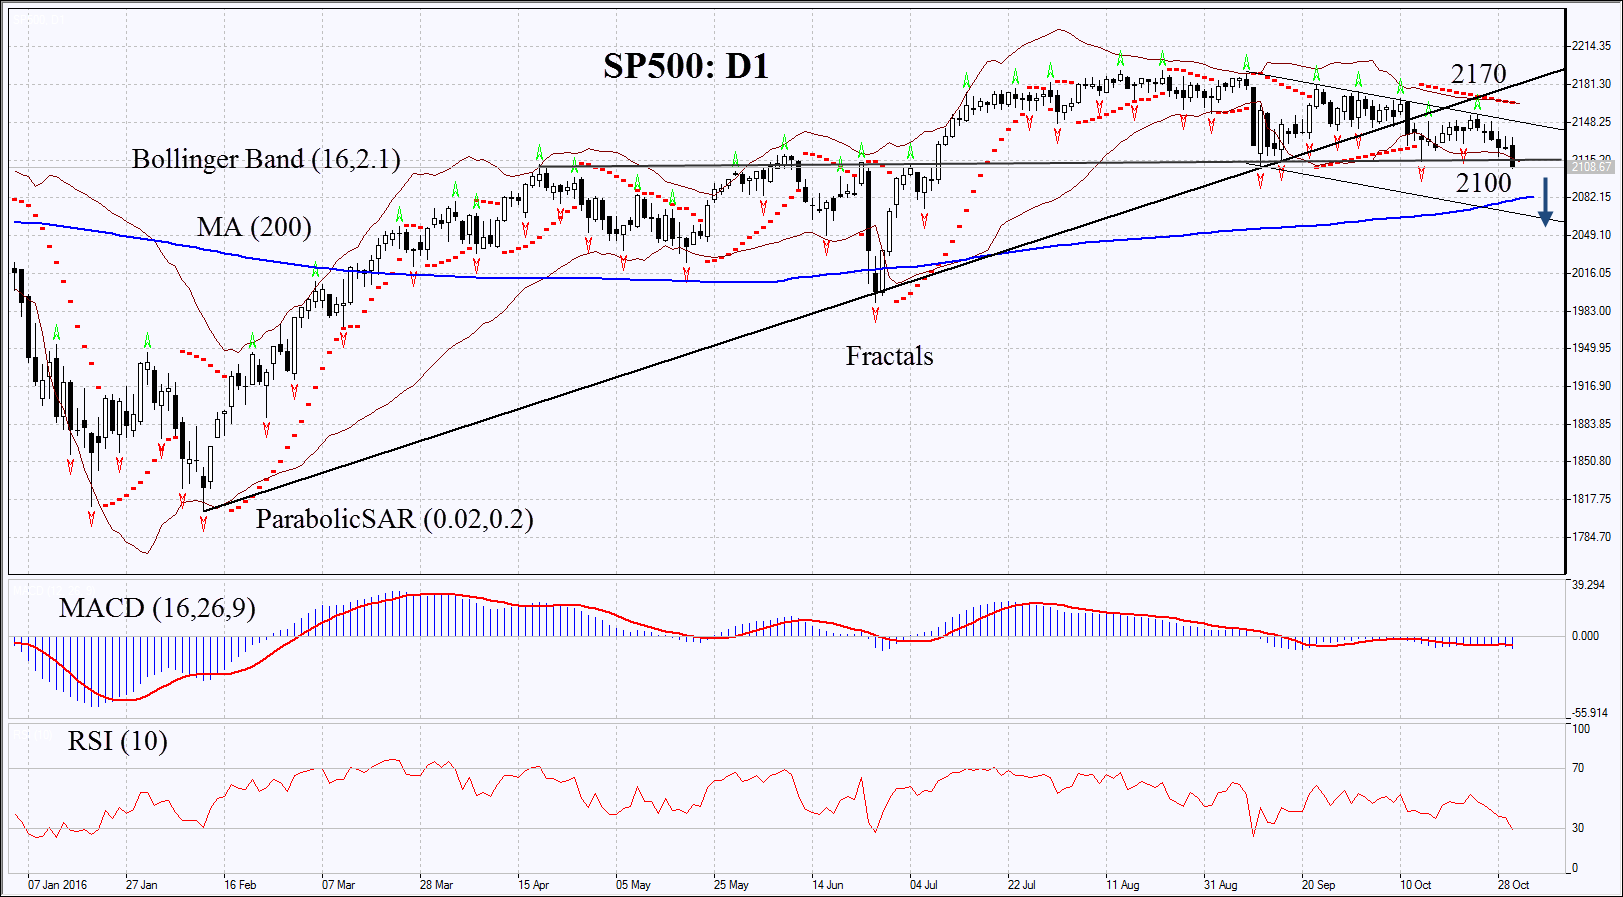
On the daily chart SP500: D1 has been trading in a narrow range for 4 months. Now it has approached its lower boundary. Further decline is possible in case of higher political risks ahead of elections and in case of weak data on US economy and corporate earnings.
- Parabolic gives bearish signal.
- Bollinger bands have narrowed a lot which means extremely low volatility. S&P500 index broke down through the lower Bollinger band.
- RSI is close to the oversold zone, no divergence.
- MACD gives bearish signals.
The bearish momentum may develop in case S&P 500 index falls below the support of the neutral trend at 2100. This level may serve the point of entry. The initial stop-loss may be placed above the Parabolic signal, the Bollinger band and the last fractal high at 2170. Having opened the pending order we shall move the stop to the next fractal high following the Parabolic and Bollinger signals. Thus, we are changing the probable profit/loss ratio to the breakeven point. The most risk-averse traders may switch to the 4-hour chart after the trade and place there a stop-loss moving it in the direction of the trade. If the price meets the stop-loss level at 2170 without reaching the order at 2100, we recommend cancelling the position: the market sustains internal changes which were not taken into account.
Summary of technical analysis
| Position | Sell |
| Sell stop | below 2100 |
| Stop loss | above 2170 |
- Get Certificate

Note:
This overview has an informative and tutorial character and is published for free. All the data, included in the overview, are received from public sources, recognized as more or less reliable. Moreover, there is no guarantee that the indicated information is full and precise. Overviews are not updated. The whole information in each overview, including opinion, indicators, charts and anything else, is provided only for familiarization purposes and is not financial advice or а recommendation. The whole text and its any part, as well as the charts cannot be considered as an offer to make a deal with any asset. IFC Markets and its employees under any circumstances are not liable for any action taken by someone else during or after reading the overview.
