- Analytics
- Technical Analysis
SUGAR Technical Analysis - SUGAR Trading: 2016-12-13
Sugar may be in some deficit in global market
U.S. Agriculture Department (USDA) expects sugar imports from Mexico to US fall in 2016/17 marketing year. Will it support sugar in US markets?
USDA revised down the forecast of sugar imports from Mexico in its December review to 972 thousand tonnes from 1.02mln tonnes in November. This is far below the 2015 reading of 1.3mln tonnes and 2014 reading of 1.5mln tonnes. Sugar production in Thailand may fall due to too rainy weather. According to Office of Cane and Sugar Board, sugar cane crops in season 2016/17 will amount to 91-92mln tonnes. Around 9.1-9.2mln tonnes of sugar may be produced from them, which is 3mln tonnes lower than in previous season. In general, market participants expect global sugar deficit to be 6.2mln tonnes in season 2016/17.
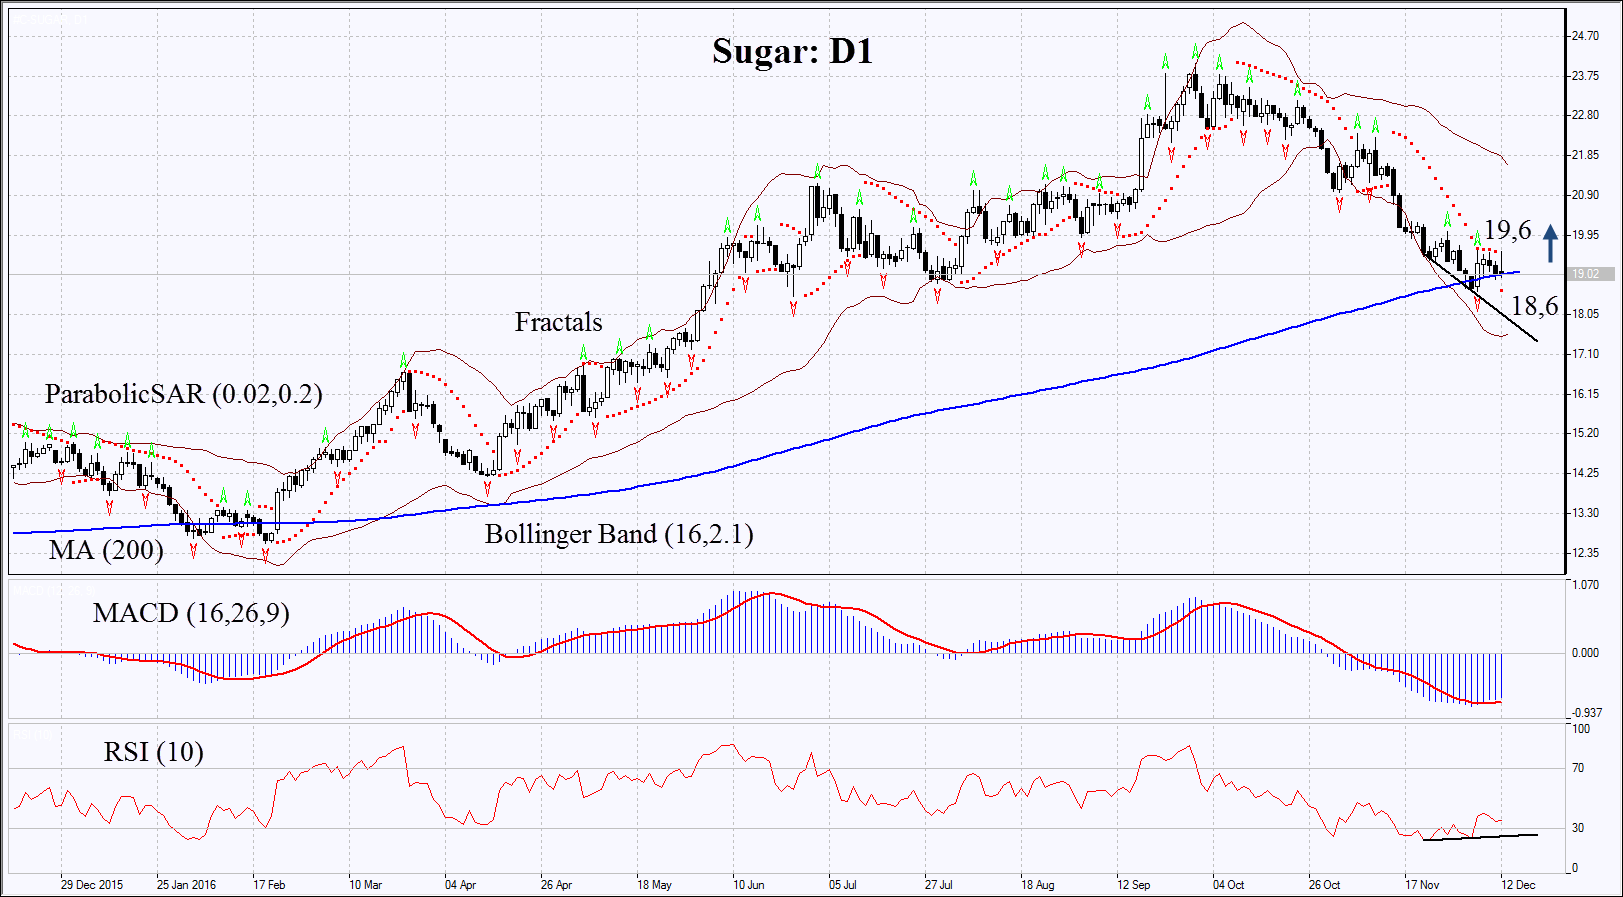
On the daily chart Sugar: D1 has corrected down to the support line of its 200-day MA but failed to surpass it. It is consolidating. Further increase is possible in case of worse forecasts of global crops or in case of higher demand.
- Parabolic gives bullish signal.
- Bollinger bands have widened which means high volatility.
- RSI is below 50. It has formed positive divergence.
- MACD gives bullish signal.
The bullish momentum may develop in case Sugar surpasses the last fractal high and Parabolic signals at 19.6. This level may serve the point of entry. The initial stop-loss may be placed below the last fractal low, the Parabolic signal and 200-day moving average at 18.6. Having opened the pending order we shall move the stop to the next fractal low following the Parabolic and Bollinger signals. Thus, we are changing the probable profit/loss ratio to the breakeven point. The most risk-averse traders may switch to the 4-hour chart after the trade and place there a stop-loss moving it in the direction of the trade. If the price meets the stop-loss level at 18.6 without reaching the order at 19.6, we recommend cancelling the position: the market sustains internal changes which were not taken into account.
Summary of technical analysis
| Position | Buy |
| Buy stop | above 19.6 |
| Stop loss | below 18.6 |
- Get Certificate

Note:
This overview has an informative and tutorial character and is published for free. All the data, included in the overview, are received from public sources, recognized as more or less reliable. Moreover, there is no guarantee that the indicated information is full and precise. Overviews are not updated. The whole information in each overview, including opinion, indicators, charts and anything else, is provided only for familiarization purposes and is not financial advice or а recommendation. The whole text and its any part, as well as the charts cannot be considered as an offer to make a deal with any asset. IFC Markets and its employees under any circumstances are not liable for any action taken by someone else during or after reading the overview.
