- Analytics
- Technical Analysis
USD CAD Technical Analysis - USD CAD Trading: 2015-07-28
Awaiting probable pullback
Let us consider the USD/CAD currency chart. It climbed ahead of the regular FRS meeting, expected on Tuesday. Most market participants suppose that the American regulator will make some statements, confirming the first since 2006 rate hike this October. However, a number of investor assume that the decision may be postponed till the next year. Bank of Canada has already cut the rate twice in 2005, weakening considerably the Canadian dollar. Meanwhile, the 0.5% rate is much higher than in the USA. The Canadian dollar may strengthen if Fed informs about holding back on raising the rate and if the US GDP growth does not reach the expected 2.5% (the data will be released on Thursday). To be noted, GDP in May will be published in Canada on Friday; the tentative outlook is positive.
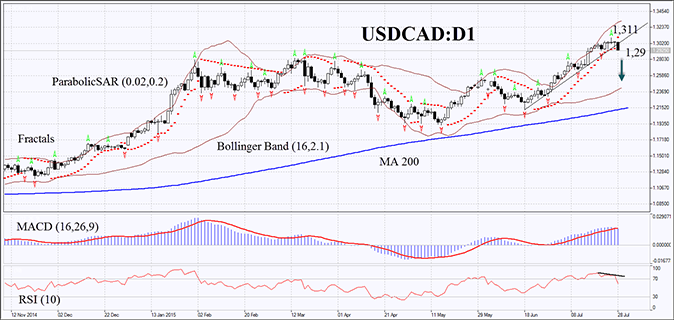
On the daily chart the USD/CAD currency pair is traded within an uptrend. Yet, most indicators do not rule out a further pullback. The instrument has bent aside from the 200-day Moving Average. RSI-Bars has shaped a bearish divergence and moved down from the overbought zone. The Parabolic indicator has formed a sell signal. The latest MACD bar has been taking shape below the signal line, indicating a bearish movement. Bollinger Bands have expanded referring to high volatility. The bearish momentum may continue if the next USD/CAD bar closes below the latest fractal low and the Parabolic signals at 1.29. A stop loss may be placed above the Parabolic signal and the fractal high, which acts at the same time as a 6-year maximum – the 1.311 mark. After pending order activation the stop loss is supposed to be moved every four hours to the next fractal high, following Parabolic and Bollinger signals. Thus, we are changing the probable profit/loss ratio to the breakeven point. The most cautious traders are recommended to switch to the H4 time frame and place a stop loss there, moving it after the trend. If the price reaches the stop loss without triggering the order, we recommend to cancel the position: the market sustains internal changes that were not considered.
| Position | Sell |
| Sell stop | below 1.29 |
| Stop loss | above 1.311 |
- Get Certificate

Note:
This overview has an informative and tutorial character and is published for free. All the data, included in the overview, are received from public sources, recognized as more or less reliable. Moreover, there is no guarantee that the indicated information is full and precise. Overviews are not updated. The whole information in each overview, including opinion, indicators, charts and anything else, is provided only for familiarization purposes and is not financial advice or а recommendation. The whole text and its any part, as well as the charts cannot be considered as an offer to make a deal with any asset. IFC Markets and its employees under any circumstances are not liable for any action taken by someone else during or after reading the overview.
