- Analytics
- Technical Analysis
USD CHF Technical Analysis - USD CHF Trading: 2016-11-09
US elections may affect US dollar rate
Member of Swiss National Bank board of directors Andrea Maechler said higher Fed rate will help it limit growth of Swiss franc by means of redirection of capital flows from Switzerland to the US. Will USDCHF rate edge up?
Swiss National Bank repeatedly said it is interested in weaker national currency. It has maintained negative interest rate of -0.75% since 2015. Andrea Maechler does not exclude the rate may go further negative if “positive outweighs negative” for economy. Previously SNB said it was not planning to limit the balance. It means the Bank is ready to pump francs to the economy and for currency interventions. At the same time, bank’s monetary policy is aimed at reaching positive inflation with keeping low unemployment level. Meanwhile, deflation of -0.2% annually was recorded in Switzerland in October 2016. Unemployment remained low at 3.3%. We believe this encourages further monetary easing by SNB in future. In theory, victory of Democrat Hillary Clinton may make US dollar stronger in short time. Next significant economic data will come out in Switzerland on November 16 – ZEW investor confidence index for November. The next SNB meeting will take place on December 2016. No change in rate is anticipated.
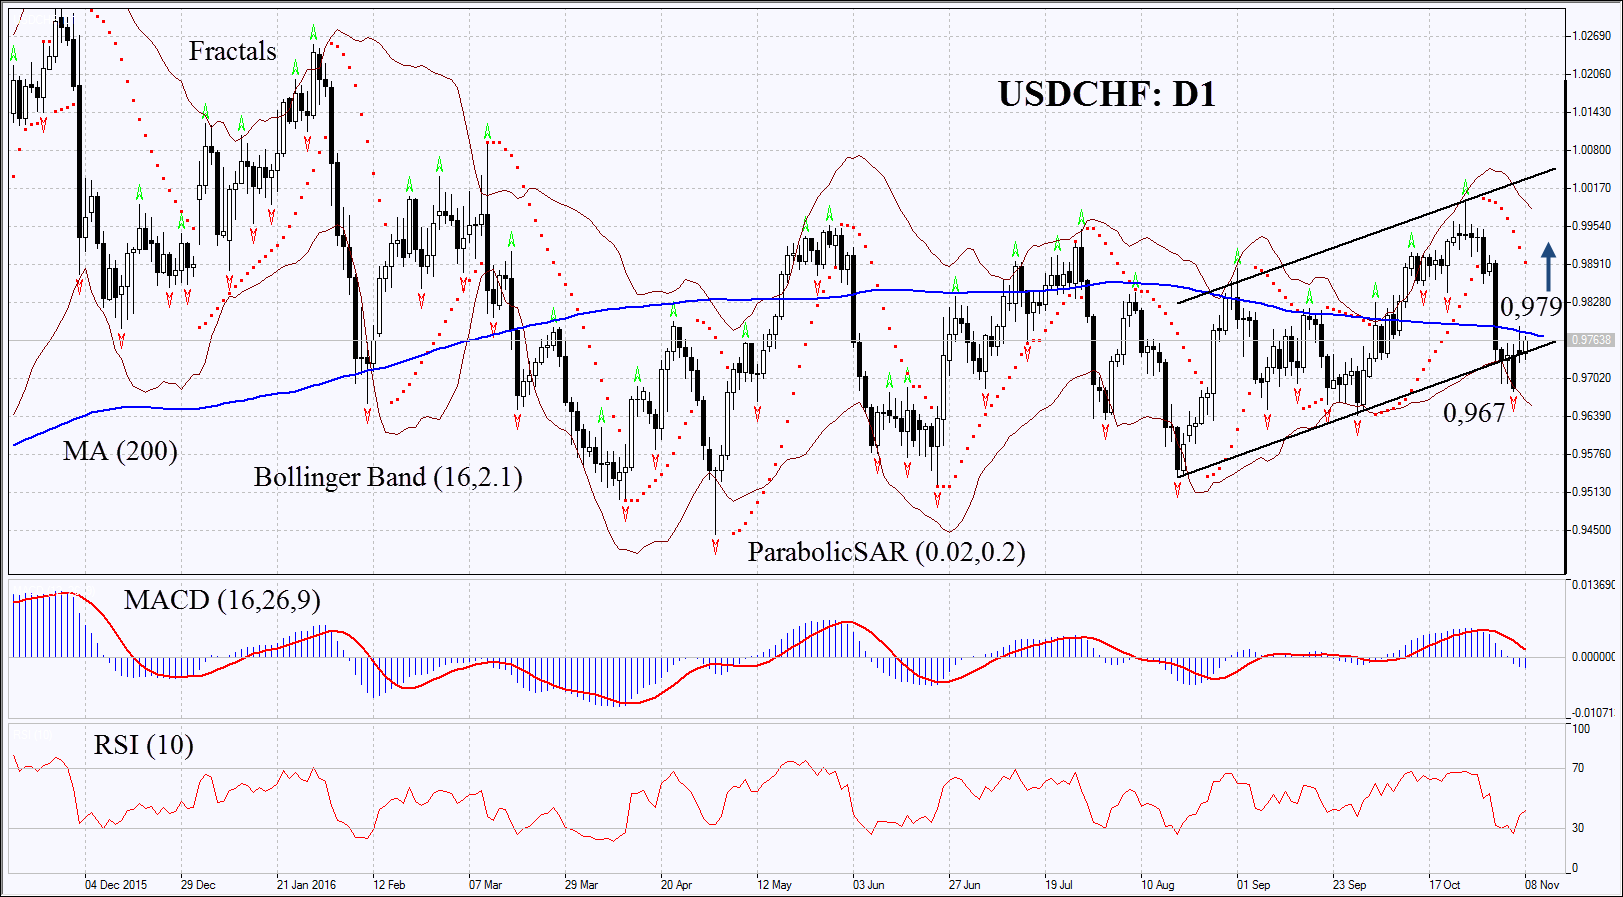
On the daily chart USDCHF: D1 is struggling for returning to the rising channel. Its further increase is possible in case of further monetary easing by Swiss National Bank and/or US interest rate hike. Technical analysis does not yet give clear bullish signals. Position shall opened basing on how forex reacts on US presidential elections results.
- Parabolic gives bearish signals.
- Bollinger bands have widened which means higher volatility.
- RSI is below 50, no divergence.
- MACD gives bearish signals.
The bullish momentum may develop in case USDCHF returns to the rising channel and surpasses its 200-day moving average at 0.979. This level may serve the point of entry. The initial stop-loss may be placed below the last fractal low at 0.967. Having opened the pending order we shall move the stop to the next fractal low following the Parabolic and Bollinger signals. Thus, we are changing the probable profit/loss ratio to the breakeven point. The most risk-averse traders may switch to the 4-hour chart after the trade and place there a stop-loss moving it in the direction of the trade. If the price meets the stop-loss level at 0.967 without reaching the order at 0.979, we recommend cancelling the position: the market sustains internal changes which were not taken into account.
Summary of technical analysis
| Position | Buy |
| Buy stop | above 0.979 |
| Stop loss | below 0.967 |
- Get Certificate

Note:
This overview has an informative and tutorial character and is published for free. All the data, included in the overview, are received from public sources, recognized as more or less reliable. Moreover, there is no guarantee that the indicated information is full and precise. Overviews are not updated. The whole information in each overview, including opinion, indicators, charts and anything else, is provided only for familiarization purposes and is not financial advice or а recommendation. The whole text and its any part, as well as the charts cannot be considered as an offer to make a deal with any asset. IFC Markets and its employees under any circumstances are not liable for any action taken by someone else during or after reading the overview.
