- Analytics
- Technical Analysis
USD JPY Technical Analysis - USD JPY Trading: 2015-04-28
Bank of Japan will meet on Thursday
Today we consider the USD/JPY currency pair on the daily chart. Triangle shaping and consolidation have been proceeding for 4 months. We do not exclude a strong movement, if the relevant support or resistance lies are breached. To be noted, while the yen was consolidating, the American dollar added almost 9%. Since the beginning of the last year the euro and the yen have lost to dollar about 18%. Investors expect important macroeconomic data to be published this week. They may affect USD/JPY dynamics. Tomorrow at 20:00 CET Federal Reserve System will hold a meeting. Market participants anticipate statements that indicate monetary policy tightening and rate hike in the form of so called “word interventions”, capable of having an impact on the US dollar. Bank of Japan officials will meet Thursday morning. In our opinion, they may cut inflation forecast and give a hint about reducing money emission (at the moment the QE program volume is set at 80 tn yen). We remind that Fitch Ratings agency has cut Japanese credit ratings today to “A” level, which is 5 points below the maximum. We expect Moody's and Standard & Poor's to line up with Fitch Ratings. The main reason for the negative evaluation is a large debt to GDP ratio (223%). It is the highest rate among large countries. It is worth mentioning that on Friday Japan will publish a number of important economic indicators: Manufacturing and Business PMI, Construction Orders, housing market statistics, Bank Of Japan six-month report, CPI, employment and Foreign Buying Bonds and Stocks (weekly data). Besides, on April, 27 Japanese prime-minister Shinzō Abe will meet Barack Obama in the USA to discuss Pacific free trade zone. Since there are plenty of events, it is difficult to predict the USD/JPY behavior. We recommend to monitor the chart and act as the case may be.
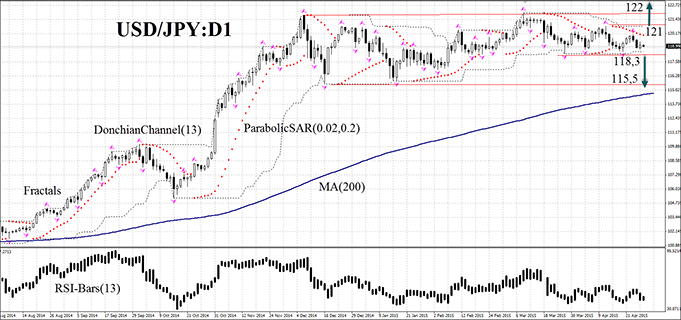
The USD/JPY have been consolidating on the daily chart. The curve has the shape of an over-extended double top pattern. Yet, the price channel remains neutral together with RSI-Bars indicator. Its latest bars have moved below 50. The Moving Average incline angle decreases as the side trend continues. We believe that if the chart escapes the neutral trend, a strong momentum will be formed. Let the market choose a scenario itself. The most important levels (118.3, 115.5 and 121/122) are confirmed by Bill Williams fractals and Donchian and Parabolic boundaries. The range may be selected, depending on the risk an investor is ready to take. Two or more pending orders may be placed symmetrically: when one of them is activated, the other can be canceled, since the market have chosen a direction. After pending order activation the Stop loss is supposed to be moved every for hours near the next fractal high (a short position) or the next fractal low (a long position), following Parabolic signals. Thus, we are changing the probable profit/loss ratio to the break-even point.
| Position | Sell |
| Sell stop | below 118,3 or 115,5 |
| Stop loss | above 121 or 122 |
| Position | Buy |
| Buy stop | above 121 or 122 |
| Stop loss | below 115,5 or 118,3 |
Dear traders. For the detailed report of the strategy, based on analytical issues of technical analysis, click here.
- Get Certificate

Note:
This overview has an informative and tutorial character and is published for free. All the data, included in the overview, are received from public sources, recognized as more or less reliable. Moreover, there is no guarantee that the indicated information is full and precise. Overviews are not updated. The whole information in each overview, including opinion, indicators, charts and anything else, is provided only for familiarization purposes and is not financial advice or а recommendation. The whole text and its any part, as well as the charts cannot be considered as an offer to make a deal with any asset. IFC Markets and its employees under any circumstances are not liable for any action taken by someone else during or after reading the overview.
