- Analytics
- Technical Analysis
USD JPY Technical Analysis - USD JPY Trading: 2015-05-25
Dollar is strengthening
Let us consider the USD/JPY currency pair on the H4 chart. The price is shaping a flag pattern and may breach the resistance line at 121.789. Parabolic confirms the uptrend and marks the global bullish momentum of the American dollar. The driving factors are FRS chair conference and unresolved Greek debt issue. To note, CPI data were released in the USA on Friday. The indicator outstripped forecasts, making rate hike more likely. The Donchian channel incline doesn't contradict the trend. The flag pattern will probably aim to the green zone. RSI-bars assures other signals: Its bars broke out the trend resistance line.
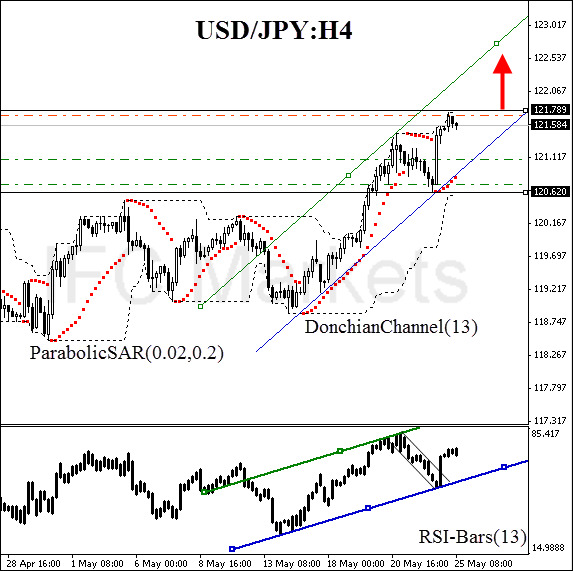
The bearish momentum is expected to continue as the 121.789 mark is crossed. The breakout will likely to bring about a movement, which range will be determined by the flag height, i.e. 80-100 points. Conservative traders are recommended to pay attention to RSI-Bars oscillator. The major trend agrees with the price consolidation. To be sure about the market direction we propose to wait until the 75% mark is breached. A stop loss may be placed at the support line, confirmed by the Donchian lower boundary and the trend line, - 120.620. After pending order activation the Stop loss is supposed to be moved every four hours near the next low, following parabolic signals. Thus we are changing the probable profit/loss ratio to the breakeven point.
| Position | Buy |
| Buy stop | above 121.789 |
| Stop loss | below 120.620 |
- Get Certificate

Note:
This overview has an informative and tutorial character and is published for free. All the data, included in the overview, are received from public sources, recognized as more or less reliable. Moreover, there is no guarantee that the indicated information is full and precise. Overviews are not updated. The whole information in each overview, including opinion, indicators, charts and anything else, is provided only for familiarization purposes and is not financial advice or а recommendation. The whole text and its any part, as well as the charts cannot be considered as an offer to make a deal with any asset. IFC Markets and its employees under any circumstances are not liable for any action taken by someone else during or after reading the overview.
