- Analytics
- Technical Analysis
Gold Technical Analysis - Gold Trading: 2015-08-26
Import to China grows for the first time in 10 months
The US are to release the GDP data for the second quarter on Thursday. In our opinion, at present this indicator is quite significant for the markets. The preliminary estimates show the substantial GDP growth of 3,2%. If the actual growth turns out to be slower, we leave open the possibility of last days trend continuation: the falling quotations and the growing gold. Let’s consider the gold performance as its import to China via HongKong has grown up to 55,06 tonnes in July after the 10-months minimum of 37,15 tonnes in June. It should be reminded that 6 weeks ago the gold hit a fresh five and a half year low. Theoretically, this minimum may serve as the support level.
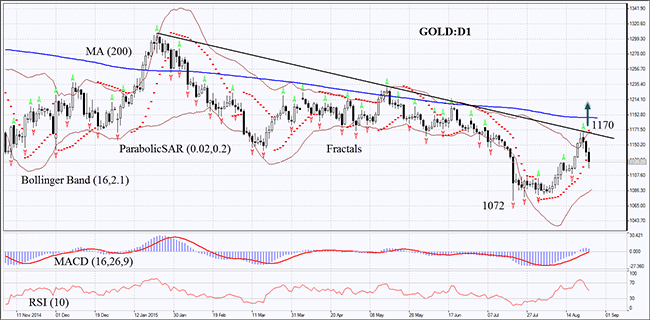
On the daily timeframe the gold XAUUSDR:D1 has reached the support level of the descending trend but failed to overcome it and reversed. The Bollinger bands have contracted which implies lower volatility. The RSI has left the oversold zone and has declined to the level of 50. MACD keeps showing the buy signal while Parabolic has formed the sell signal serving the support level as well. We do not rule out the possibility of the inversion to the bullish trend if the gold surpasses the last upper fractal, Bollinger band and the Parabolic upper signal of 1170. The preliminary risk fixation is possible below the 5.5 year low of 1072. Having opened the delayed order we recommend to move the stop every 4 hours to the next fractal minimum following the Bollinger and Parabolic signals. By doing this we are changing the potential profit/loss ratio into our favour. The most cautious traders may switch to the 4-hour timeframe after the trade and to place there a stop-loss moving it in accordance with the trade dynamics. If the price manages to overcome the stop level without the order execution we recommend to delete the position as the market is subject to the unforeseen endogenous changes.
| Position | Buy |
| Buy stop | Above 1170 |
| Stop loss | Below 1072 |
- Get Certificate

Note:
This overview has an informative and tutorial character and is published for free. All the data, included in the overview, are received from public sources, recognized as more or less reliable. Moreover, there is no guarantee that the indicated information is full and precise. Overviews are not updated. The whole information in each overview, including opinion, indicators, charts and anything else, is provided only for familiarization purposes and is not financial advice or а recommendation. The whole text and its any part, as well as the charts cannot be considered as an offer to make a deal with any asset. IFC Markets and its employees under any circumstances are not liable for any action taken by someone else during or after reading the overview.
