- Analytics
- Technical Analysis
Gold Technical Analysis - Gold Trading: 2016-12-15
Gold may react on Fed meeting results
Relatively weak economic data came out in US on Wednesday. This pushed US dollar index lower and gold prices up. Market participants will reqact on Fed meeting results. Will gold continue advancing?
US retail sales rose in November less than expected. Industrial production came out not only below forecasts but also showed record decline in 8 months. At the same time, producer price index advanced 1.4% which is its record increase in 12 months. As a result, Atlanta Fed cut forecast for GDP growth in Q4 2016 to +2.6% compared to +3.2% in Q3. Some market participants point at higher inflation risks. All this had negative effect on US currency. Main trigger for its further increase will be the Fed enlightenment of further monetary policy. Investors consider gold as an alternative to US assets and its prices are negatively correlated with US dollar index. Meanwhile, the process of banknotes change is edging in India. This may restore demand for jewelry.
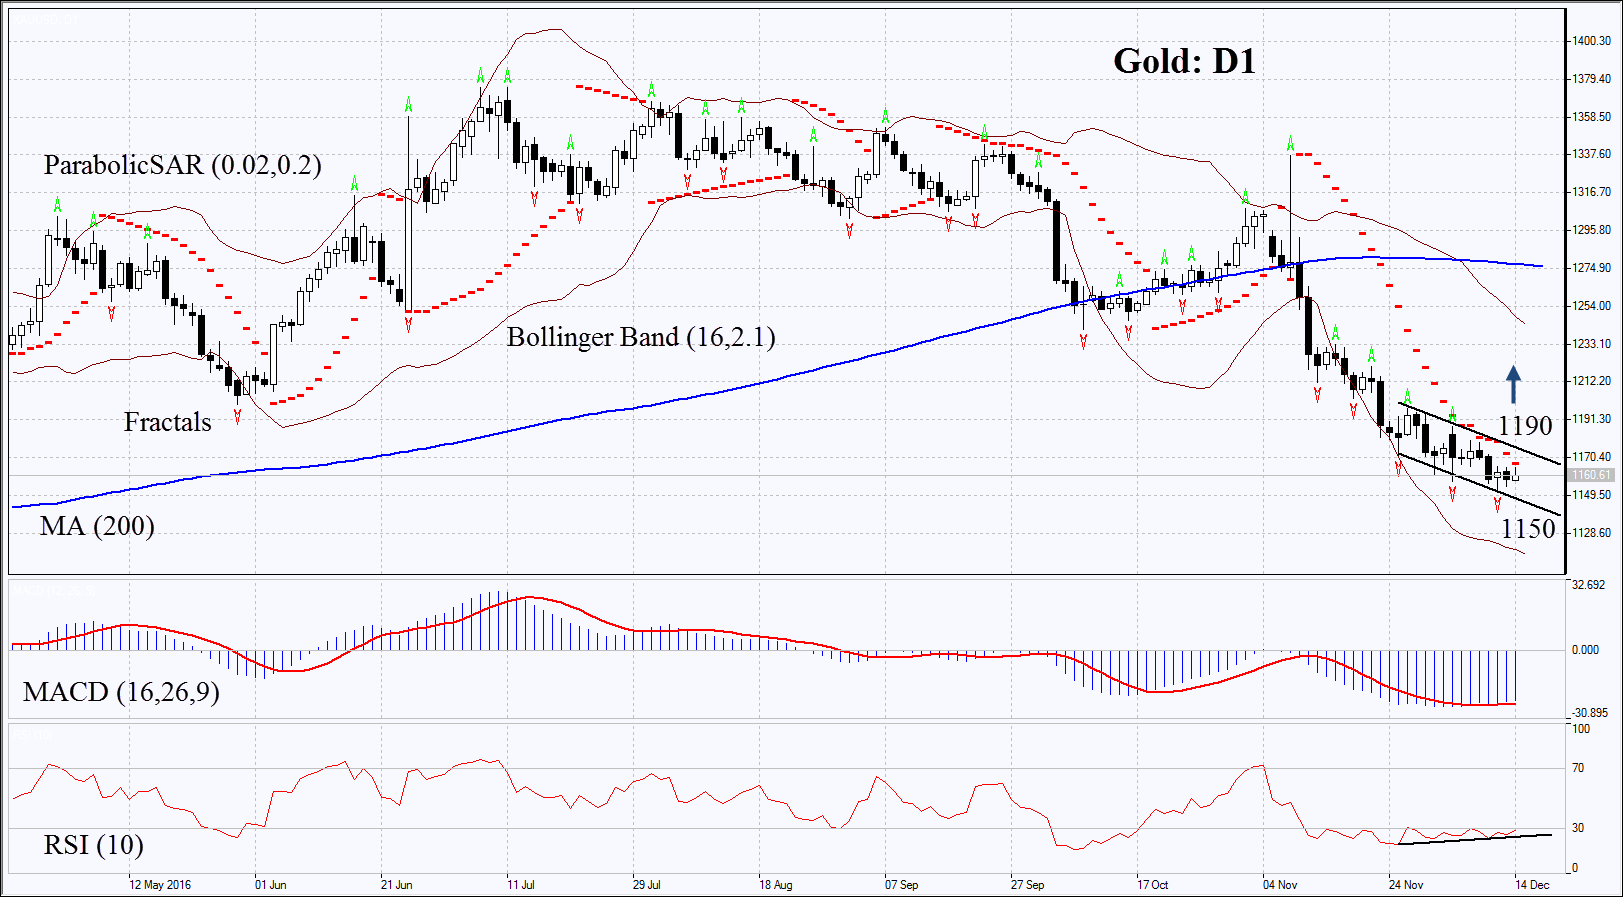
On the daily chart XAUUSD: D1 is within the downtrend. Its pace of decline slowed down and several indicators have formed signals for upwards retracement. Further price increase is possible in case of lower US dollar index and higher demand for gold.
- Parabolic gives bearish signal. It may serve the resistance line that is to be surpassed.
- Bollinger bands have widened which means high volatility.
- RSI is in the oversold zone. It has formed positive divergence.
- MACD gives bullish signal.
The bullish momentum may develop in case Gold surpasses the last fractal high and the Parabolic signals at 1190. This level may serve the point of entry. The initial stop-loss may be placed below the last fractal low and the 9-month low at 1150. Having opened the pending order we shall move the stop to the next fractal low following the Parabolic and Bollinger signals. Thus, we are changing the probable profit/loss ratio to the breakeven point. The most risk-averse traders may switch to the 4-hour chart after the trade and place there a stop-loss moving it in the direction of the trade. If the price meets the stop-loss level at 1150 without reaching the order at 1190, we recommend cancelling the position: the market sustains internal changes which were not taken into account.
Summary of technical analysis
| Position | Buy |
| Buy stop | above 1190 |
| Stop loss | below 1150 |
- Get Certificate

Note:
This overview has an informative and tutorial character and is published for free. All the data, included in the overview, are received from public sources, recognized as more or less reliable. Moreover, there is no guarantee that the indicated information is full and precise. Overviews are not updated. The whole information in each overview, including opinion, indicators, charts and anything else, is provided only for familiarization purposes and is not financial advice or а recommendation. The whole text and its any part, as well as the charts cannot be considered as an offer to make a deal with any asset. IFC Markets and its employees under any circumstances are not liable for any action taken by someone else during or after reading the overview.
