- Analytics
- Technical Analysis
Gold vs Yuan Technical Analysis - Gold vs Yuan Trading: 2017-01-26
Investors calm down after Trump’s inauguration
In this report we suggest studying the personal composite instrument (PCI) ” Gold against yuan”. Price is falling in the chart when gold retreats in global markets and when yuan gets stronger against the US dollar. Will XAUCNH continue sliding down?
The reverse trend has been observed since the start of 2017: gold was advancing while yuan was losing ground mainly due to the investors’ concerns that economic policy of new US president Donald Trump may heighten global risks. Two focus areas of US officials have been highlighted so far – exit from TPP and revision of NAFTA trade agreement. Some investors believe that TPP was initially planned to counterbalance the Chinese economic growth. Probable revocation of TPP may make Chinese yuan stronger. In NAFTA agreement main changes concerned the economy of Canada. The latest comments of US officials showed that NAFTA agreement will be changed only after the mutual consultations with Canada and relieved investors’ concerns pushing Canadian dollar up. Al this could have weighed on gold prices and demand on gold as a safe-haven asset. The holdings of SPDR Gold Trust fell almost 3 tonnes on Tuesday compared to Monday to 804.11 tonnes. Lunar New Year holidays will start in China on Friday. In theory, weekends and holidays may make XAUCNH retrace. Next significant economic data will come out in China early in February 2017.
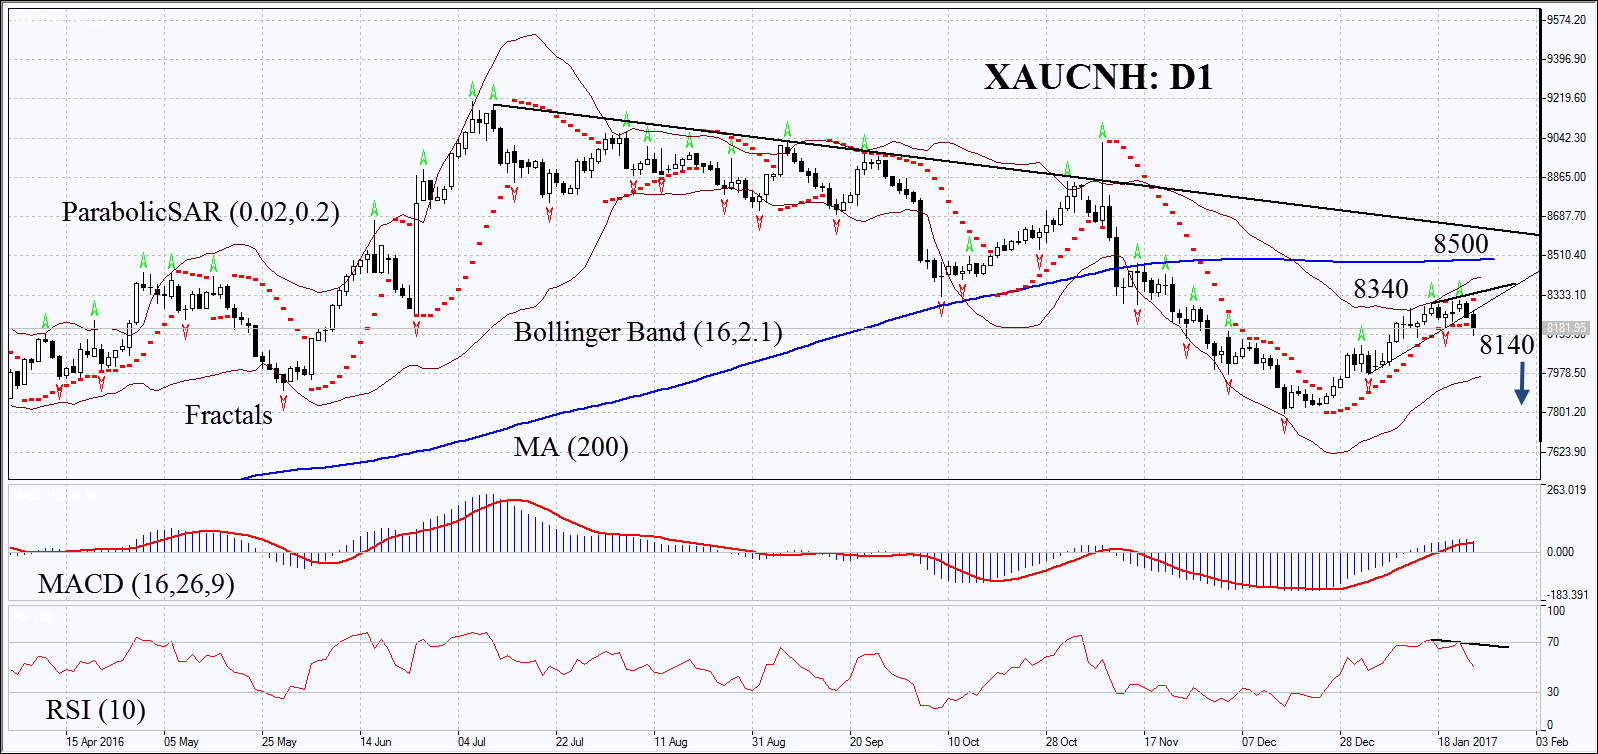
On the daily chart XAUCNH: D1 is correcting down after increase that started late last December. At the same time, midterm downtrend persists. Further decline is possible in case of lower demand for gold and if positive economic data come out in China.
- The Parabolic indicator gives signal to sell.
- The Bollinger bands have narrowed which means lower volatility.
- The RSI is above 50 having formed negative divergence.
- The MACD gives weak bearish signals.
The bearish momentum may develop in case Мы не исключаем медвежьего движения, если XAUCNH falls below the last low at 8140. This level may serve the point of entry. The initial stop-loss may be placed above the Parabolic signal and the last fractal high at 8340. Having opened the pending order we shall move the stop to the next fractal high following the Parabolic and Bollinger signals. Thus, we are changing the probable profit/loss ratio to the breakeven point. The most risk-averse traders may switch to the 4-hour chart after the trade and place there a stop-loss moving it in the direction of the trade. If the price meets the stop-loss level at 8340-8500 without reaching the order at 8140, we recommend cancelling the position: the market sustains internal changes which were not taken into account.
Summary of technical analysis
| Position | Sell |
| Sell stop | below 8140 |
| Stop loss | above 8340 - 8500 |
- Get Certificate

Note:
This overview has an informative and tutorial character and is published for free. All the data, included in the overview, are received from public sources, recognized as more or less reliable. Moreover, there is no guarantee that the indicated information is full and precise. Overviews are not updated. The whole information in each overview, including opinion, indicators, charts and anything else, is provided only for familiarization purposes and is not financial advice or а recommendation. The whole text and its any part, as well as the charts cannot be considered as an offer to make a deal with any asset. IFC Markets and its employees under any circumstances are not liable for any action taken by someone else during or after reading the overview.
