- Analytics
- Technical Analysis
Exxon Stocks Technical Analysis - Exxon Stocks Trading: 2017-02-23
Oil price increase may trigger shale plays development
In this report we consider studying the personal composite instrument (PCI) ”Exxon Mobil stocks against Brent”. It may increase in case Exxon Mobil stocks growth outpaces the Brent oil prices.
In 2016 the oil service producer Exxon Mobil reported its lowest earnings in recent 20 years and had to white off some assets. Given low oil prices, the development of some of the company’s plays may also be deemed unprofitable. For this reason, the company’s stocks slumped 9.3% since early 2017. Exxon Mobil makes part of Dow Jones Industrial Average index which rose 5% since the start of this year. The main reason for such negative performance is that investors worry that the company will have to write off the additional part of its assets. Besides the Canada’s stockpiles of 3.6bn barrels, Exxon Mobil holds shale oil stockpiles of 6bn barrels in the Permian Basin in the US state of Texas. Meanwhile, as mentioned previously, the development of shale plays may be profitable with WTI price at $50-55 a barrel. The level is closed to the current prices which may negatively affect the operating performance of Exxon Mobil. The global oil prices have potential for further increase. OPEC and Goldman Sachs investment bank forecast the significant decline in global stocks in 2nd quarter of 2017. They believe the main reason for that may be quick fulfillment of OPEC and independent oil producers agreement to cut oil production by 1.8mln barrels a day since January 1, 2017. According to the most recent data, the agreement is implemented by 90% already. The additional positive for Exxon Mobil may come if Rex Tillerson is appointed as secretary of state under Trump’s presidency. Rex Tillerson has been serving in the capacity of the company for more than 40 years.
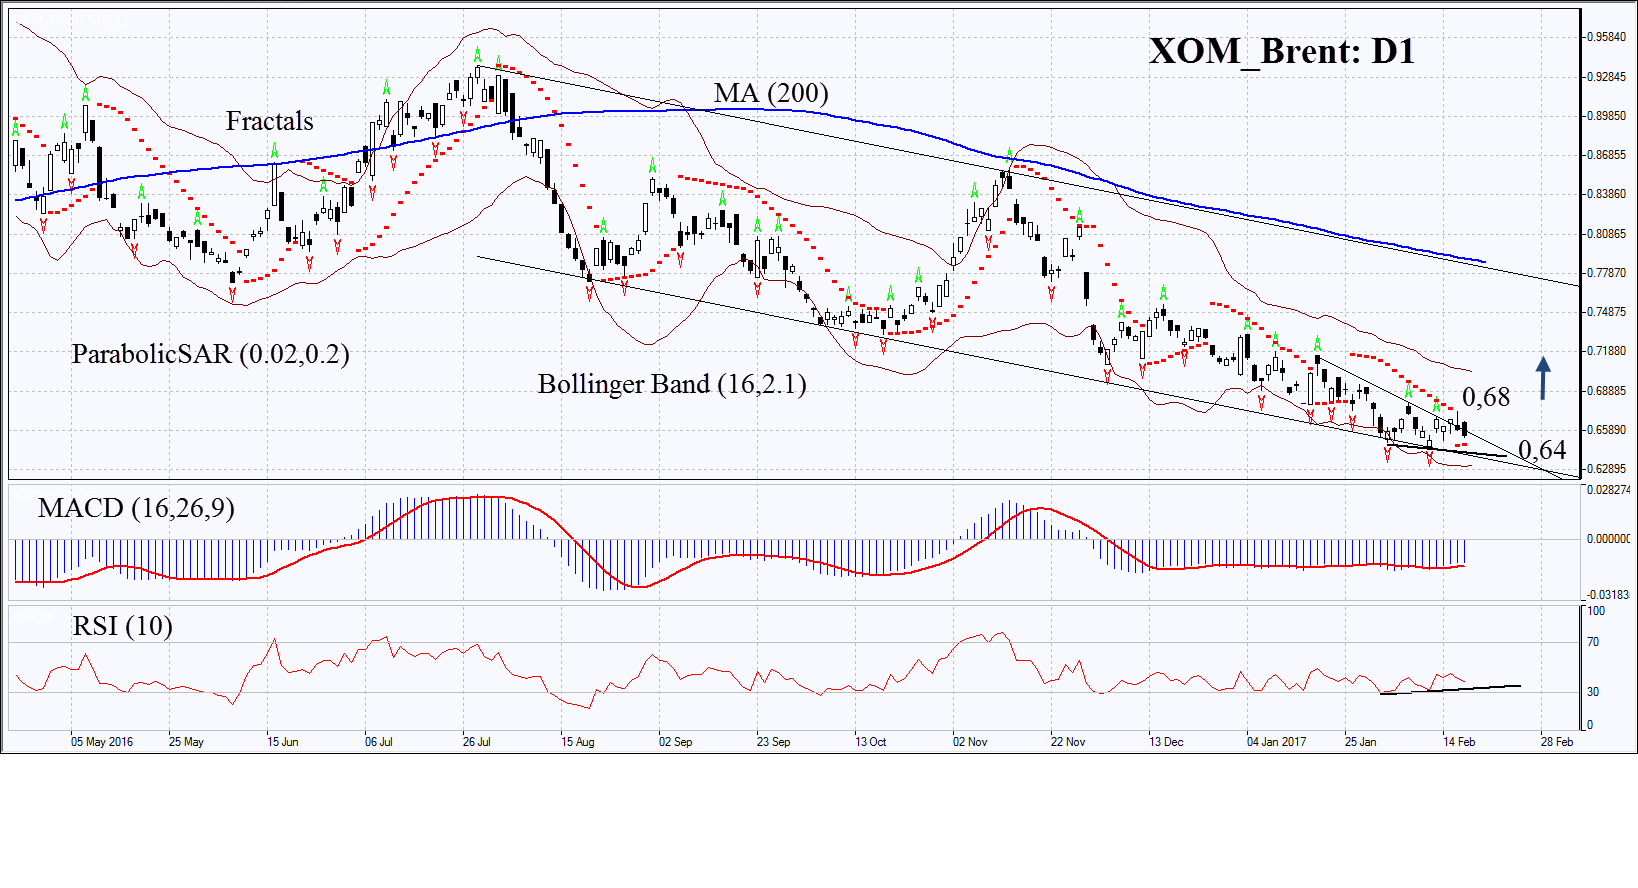
On the daily chart XOM/BRENT: D1 has hit a fresh 17-month low having approached the lower boundary of the descending channel. Upward correction is possible in case Exxon Mobil stocks perform better than Brent oil.
- The Parabolic indicator gives bullish signal.
- The Bollinger bands have narrowed which means lower volatility.
- The RSI is below 50. It has formed positive divergence.
- The MACD is giving bullish signals.
The bullish momentum may develop in case XOM/BRENT surpasses the two last fractal highs at 0.68. This level may serve the point of entry. The initial stop-loss may be placed below the last fractal low, the 17-month low and the Parabolic signal at 0.64. Having opened the pending order we shall move the stop to the next fractal low following the Parabolic and Bollinger signals. Thus, we are changing the probable profit/loss ratio to the breakeven point. The most risk-averse traders may switch to the 4-hour chart after the trade and place there a stop-loss moving it in the direction of the trade. If the price meets the stop-loss level at 0.64 without reaching the order at 0.68, we recommend cancelling the position: the market sustains internal changes which were not taken into account.
Summary of technical analysis
| Position | Buy |
| Buy stop | above 0.68 |
| Stop loss | below 0.64 |
- Get Certificate

Note:
This overview has an informative and tutorial character and is published for free. All the data, included in the overview, are received from public sources, recognized as more or less reliable. Moreover, there is no guarantee that the indicated information is full and precise. Overviews are not updated. The whole information in each overview, including opinion, indicators, charts and anything else, is provided only for familiarization purposes and is not financial advice or а recommendation. The whole text and its any part, as well as the charts cannot be considered as an offer to make a deal with any asset. IFC Markets and its employees under any circumstances are not liable for any action taken by someone else during or after reading the overview.
