- Análisis
- Análisis Técnico
USD/CHF Análisis Técnico - USD/CHF Trading: 2014-10-20
Bearish sentiment
Good afternoon, dear traders. Today we consider the USD/CHF currency pair on the D1 chart. At the moment we can see that the price came out of the uptrend price channel and crossed the trend line downwards. The candlestick pattern “absorption” indicates the trend reversal: the body of the second bearish candlestick exceeds significantly the body of the previous white candlestick (marked in red ellipse on the chart). That means the bullish trend is weak, and now bears are gaining strength. There is no contradiction on the part of the RSI-Bars oscillator: the graphic model “double top” can be observed on the oscillator chart. It outlines the bullish trend termination and the onset of the bearish one. The current downtrend direction is confirmed by the Parabolic values. You can wait for the last confirmatory signal from DonchianChannel, when the price breaks the fractal support level at 0.9358. This mark can be used for placing a pending sell order. Stop Loss is recommended to be placed at 0.9687. The mark is confirmed by Bill Williams fractal, the upper boundary of DonchianChannel and Parabolic values.
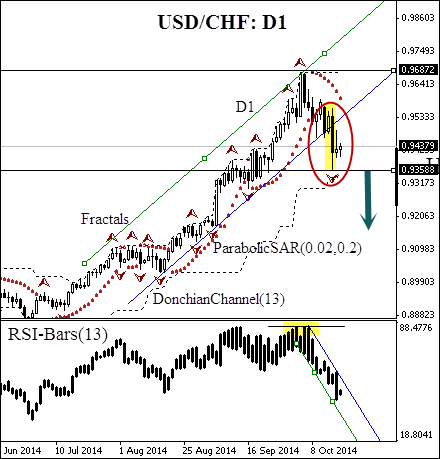
| Position | Sell |
| Sell stop | below 0.93588 |
| Stop loss | above 0.96872 |
Dear traders. You can see the detailed report of the author’s account by clicking here.
- Obtener certificado

Nota:
Este resumen tiene carácter informativo-educativo y se publica de forma gratuita. Todos los datos que contiene este resumen, son obtenidos de fuentes públicas que se consideran más o menos fiables. Además, no hay niguna garantía de que la información sea completa y exacta. En el futuro, los resúmenes no se actualizarán. Toda la información en cada resumen, incluyendo las opiniones, indicadores, gráficos y todo lo demás, se proporciona sólo para la observación y no se considera como un consejo o una recomendación financiera. Todo el texto y cualquier parte suya, así como los gráficos no pueden considerarse como una oferta para realizar alguna transacción con cualquier activo. La compañía IFC Markets y sus empleados en cualquier circunstancia no son responsables de ninguna acción tomada por otra persona durante o después de la observación del resumen.
