- マーケット分析
- テクニカル分析
綿花 テクニカル分析 - 綿花 取引:2015-10-14
Markets concerned by probable cotton deficit
The cotton prices hit the high of three weeks after the US Department of Agriculture (USDA) its production forecast. The additional factor contributing to price growth is the farmers strike in Pakistan. The cotton chart has formed the channel tilted upwards. Will the price reach the upper channel line?
In October report USDA has the US cotton production forecast in 2015/16 to 13.34mln bags of 480 pounds each from 13.43mln in September report. The estimation of future cotton yield in India was also revised down from 29mln bags to 28.5mln due to the scanty rainfall. Some market participants state that the US farmers are holding their cotton awaiting higher prices. The current prices are just 9% higher the 6-year low of 57.54 and are threefold lower the high of 2011.
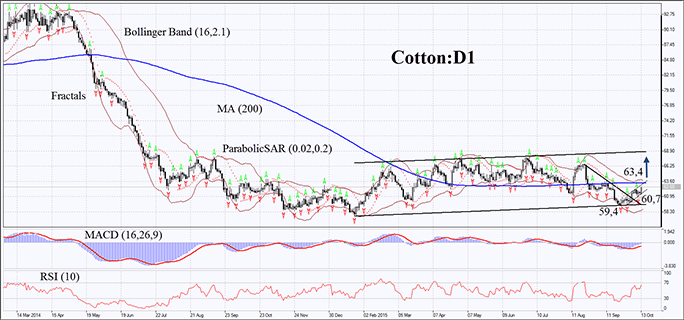
On the daily chart, COTTON:D1 is moving up within the formed ascending price channel. On Tuesday it has surpassed the last Bill Williams fractals high. The MACD and Parabolic indicators give the buy signals. RSI is above 50 but has not yet reached the overbought zone.The Bollinger Bands are contracting which may signify lower volatility. The bullish momentum can develop in case the cotton prices surpass the 200-day moving average line and the upper Bollinger Band. Their breakout can serve the point of entry at 63.4. The initial risk limit is possible below the Parabolic indicator signal and the last fractal low at 60.7. The lower price channel line and the third fractal low at 59.4 can be used for placing stop loss. Having opened the pending order we shall move the stop to the next fractal low following the Parabolic and Bollinger signals every 4 hours. Thus, we are changing the probable profit/loss ratio to the breakeven point. The most risk-averse traders may switch to the 4-hour chart after the trade and place there a stop-loss moving it in the direction of the trade. If the price meets the stop-loss level at 60.7 or 59.4 without reaching the order at 63.4, we recommend cancelling the position: the market sustains internal changes which were not taken into account.
| Position | Buy |
| Buy stop | above 63,4 |
| Stop loss | below 60,7 or 59,4 |
- コースを取って、

【重要な注意事項】:
本レポートは、当社の親会社であるアイエフシーマーケットが作成したものの邦訳です。本レポートには、当社のサービスと商品についての情報を含みますが、お客様の投資目的、財務状況、資金力にかかわらず、情報の提供のみを目的とするものであり、金融商品の勧誘、取引の推奨、売買の提案等を意図したものではありません。 本レポートは、アイエフシーマーケットが信頼できると思われる情報にもとづき作成したものですが、次の点に十分ご留意ください。アイエフシーマーケットおよび当社は、本レポートが提供する情報、分析、予測、取引戦略等の正確性、確実性、完全性、安全性等について一切の保証をしません。アイエフシーマーケットおよび当社は、本レポートを参考にした投資行動が利益を生んだり損失を回避したりすることを保証または約束あるいは言外に暗示するものではありません。アイエフシーマーケットおよび当社は、本レポートに含まれる不確実性、不正確性、不完全性、誤謬、文章上の誤り等に起因して、お客様または第三者が損害(直接的か間接的かを問いません。)を被った場合でも、一切の責任を負いません。
