- マーケット分析
- テクニカル分析
Nikkei (225), 株価指数 テクニカル分析 - Nikkei (225), 株価指数 取引:2015-10-12
Japanese index pushed up by oil price
The Japanese currency continues losing its positions. Markets expect the Bank of Japan to revise down the key rate in October. The move shall stimulate the business lending amid the slowing Japanese GDP growth of 1% a year and to weaken the currency against the dollar. By the way, the US dollar index live data indicate US dollar weakened 0.5% against six major currencies during the one week period. Another factor is the Brent crude oil price going up by 12% last week which is the weekly record since 2009. As the oil price has a huge influence on the inflationary expectations, the major indices are growing over a week. Nikkei is not an exception given the weaker Yen and the looser monetary policy by the Bank of Japan. Will the index manage to secure its growth and comfort investors?
At this moment we are seeing the end of the bearish trend on the Nikkei daily chart. The price is consolidated near the weekly support and is ready to break the channel. The Parabolic trend indicator has shown the bullish reversal near the support. The oscillator RSI-Bars dynamics compels attention having formed the uptrend channel. We assume the breakout of the 18490.4 price level will provoke the volatility momentum and the sharp index growth. This signal is likely to be accompanied by leaving the channel, the upper line of which is confirmed by the Donchian channel. It is worthy of note that the resistance of 18490.4 was twice confirmed by the Bill Williams fractals. The support of 16893.5 rests, in its turn, upon the weekly support and is confirmed by two trend indicators. This means the level may be used to limit risks.
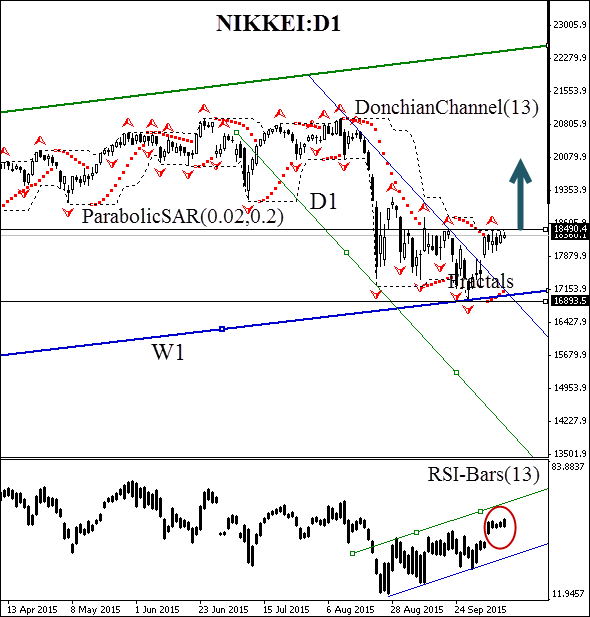
We suggest opening the pending order to buy after the breakout of the resistance at 18490.4. The aggressive traders may place a delayed order at this level which is confirmed by the Donchian channel. The risk limits shall be fixed at the previous Bill Williams fractal low at 18490.4 (the lower channel line). The stop shall be moved to the next low following the Parabolic signal. Thus, we are changing the probable profit/loss ratio to the breakeven point. Despite the high probability of this scenario the index may lose its rising momentum. First of all, the risks are inherent in the US Fed rate hike. The move may lower the inflationary expectations and strengthen the Japanese currency. Nevertheless, we consider the Nikkei channel breakout to be possible only in case of the long term fundamental trend.
| Position | Buy |
| Buy stop | above 18490.4 |
| Stop loss | below 16893.5 |
- コースを取って、

【重要な注意事項】:
本レポートは、当社の親会社であるアイエフシーマーケットが作成したものの邦訳です。本レポートには、当社のサービスと商品についての情報を含みますが、お客様の投資目的、財務状況、資金力にかかわらず、情報の提供のみを目的とするものであり、金融商品の勧誘、取引の推奨、売買の提案等を意図したものではありません。 本レポートは、アイエフシーマーケットが信頼できると思われる情報にもとづき作成したものですが、次の点に十分ご留意ください。アイエフシーマーケットおよび当社は、本レポートが提供する情報、分析、予測、取引戦略等の正確性、確実性、完全性、安全性等について一切の保証をしません。アイエフシーマーケットおよび当社は、本レポートを参考にした投資行動が利益を生んだり損失を回避したりすることを保証または約束あるいは言外に暗示するものではありません。アイエフシーマーケットおよび当社は、本レポートに含まれる不確実性、不正確性、不完全性、誤謬、文章上の誤り等に起因して、お客様または第三者が損害(直接的か間接的かを問いません。)を被った場合でも、一切の責任を負いません。
