- Analiz
- Teknik analiz
EUR/USD Teknik Analiz - EUR/USD Ticaret: 2014-10-01
Nonfarm: euro sentenced?
Good afternoon, dear traders. Today at 14:15 CET we expect the release of the key US macroeconomic index: ADP Non-Farm Employment Change. This indicator is published in monthly terms by Automatic Data Processing. The characteristics are based on anonymous data study of approximately 400,000 American business clients. The analysis does not include the agricultural sector and government posts. The tentative estimate of employment level is released two days before the official publication of Non-Farm index by the US Bureau of Labor Statistics. That is why this index is worth a closer examination. Employment is the key factor influencing the US consumer demand, so if the index performance is higher than expected, it will almost certainly lead to an increase in the US investment and raised demand for the US dollar against other liquid currencies, including the euro.
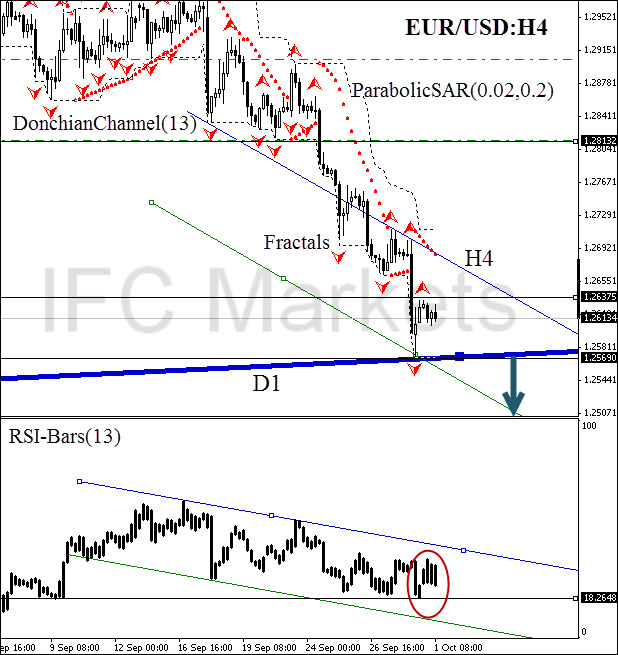
After position opening, Trailing Stop is to be moved after the Parabolic values, near the next fractal peak. Updating is enough to be done every day after a new Bill Williams fractal formation (5 candlesticks). Thus, we are changing the probable profit/loss ratio to the breakeven point.
| Position | Sell |
| Sell stop | below 1.25690 |
| Stop loss | above 1.26375 |
- Sertifika Al

Not:
Bu bilgilendirici ve eğitici bir genel bakıştır ve ücretsiz olarak yayımlanmaktadır. Burada yer alan tüm veriler kamu kaynaklarından alınmış ve az çok güvenilir olarak kabul edilmiştir. Aynı zamanda, bilgilerin tam ve doğru olduğuna dair hiçbir garanti yoktur. Gelecekte bunlar güncellenmemektedirler. Görüşler, göstergeler, grafikler ve kalan her şey dahil olmak üzere her genel bakışta olan tüm bilgiler sadece değerlendirme amacıyla sağlanıp mali dalışmanlık veya tavsiye niteliğinde değildirler. Tüm metin ve onun herhangi bir bölümünü veya grafikleri herhangi bir varlıkla işlem yapmak için bir teklif olarak kabul edilemez. IFC Markets şirketi ve şirket çalışanları bu genel bakışın incelenmesi sırasında veya sonrasında başkası tarafından alınan herhangi bir eylem için hiçbir koşulda sorumlu değildir.
