- Analiz
- Teknik analiz
EUR/USD Teknik Analiz - EUR/USD Ticaret: 2015-04-20
Consolidation
Let us consider the EUR/USD currency pair on the H4 time frame. The price has made a bullish turn close to the triple bottom (1.05167) and is moving within an ascending corridor. To be noted, the triple bottom level was confirmed by RSI-Bars. The oscillator's side channel clearly indicates the consolidation. The price can gain a new momentum towards the green zone after having consolidated. Two resistance lines are located on the way: 1.08509 and 1.08934. They are both confirmed by the Donchian channel upper boundary, ParabolicSar historical values and Bill Williams fractals.
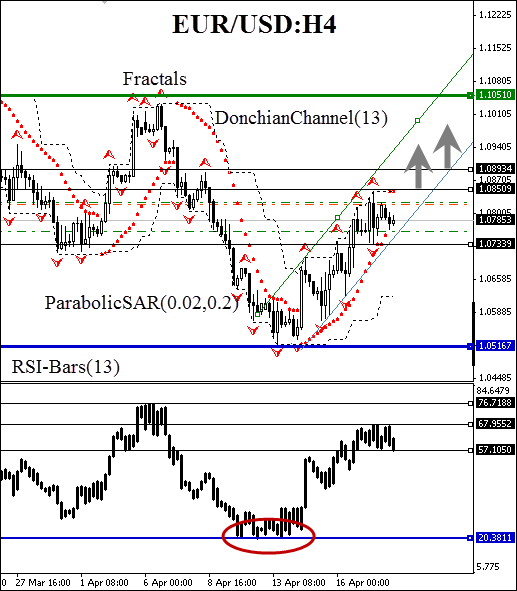
The daily resistance at 1.10510 is the closest mark to place a stop loss. Conservative traders are recommended to wait until the oscillator support is breached at 68% and open a partial volume position (50%), when the buy pending order (placed at 1.08509) is activated. The position may be built up as the next resistance line is breached at 1.08934. A stop loss may be placed at the closest support level at 1.07339. This mark is confirmed by Parabolic historical values and the H4 trend. After pending order activation the stop loss is to be moved every four hours near the next fractal low, following Parabolic signals. Thus we are changing the probable profit/loss ratio to the breakeven point.
| Position | Buy |
| Buy stop | above 1.08509 and 1.08934 |
| Stop loss | below 1.07339 |
- Sertifika Al

Not:
Bu bilgilendirici ve eğitici bir genel bakıştır ve ücretsiz olarak yayımlanmaktadır. Burada yer alan tüm veriler kamu kaynaklarından alınmış ve az çok güvenilir olarak kabul edilmiştir. Aynı zamanda, bilgilerin tam ve doğru olduğuna dair hiçbir garanti yoktur. Gelecekte bunlar güncellenmemektedirler. Görüşler, göstergeler, grafikler ve kalan her şey dahil olmak üzere her genel bakışta olan tüm bilgiler sadece değerlendirme amacıyla sağlanıp mali dalışmanlık veya tavsiye niteliğinde değildirler. Tüm metin ve onun herhangi bir bölümünü veya grafikleri herhangi bir varlıkla işlem yapmak için bir teklif olarak kabul edilemez. IFC Markets şirketi ve şirket çalışanları bu genel bakışın incelenmesi sırasında veya sonrasında başkası tarafından alınan herhangi bir eylem için hiçbir koşulda sorumlu değildir.
