- Analiz
- Teknik analiz
GBP/USD Teknik Analiz - GBP/USD Ticaret: 2014-10-23
Pending British pound
Today we consider the daily chart of GBP/USD currency pair. The price is going down within the daily and weekly downtrend channel. There was a breakout of the daily trend line, but we assume it to be false: at the moment the price went back to the trend line. The downtrend price movement is confirmed by the DonchianChannel bias. Let us consider the RSI-Bars oscillator chart: we can observe that the triangle was formed. That means the market is waiting for further action and has not decided yet on the direction. The triangle top side was breached, and that gives us a warning about a possible change in the current price trend. In order to get an additional confirmatory bearish signal, we may wait for the oscillator level breakout at 29.5458%. It will happen before Parabolic trend indicator gives us a signal by crossing the price level at 1.5869. This mark can be used for placing a pending sell order. It is reinforced with the DonchianChannel lower boundary, Parabolic historical values and Bill Williams fractal. Stop Loss is recommended to be placed at the high of 1.6233. Its significance is confirmed by the fractal and Parabolic values.
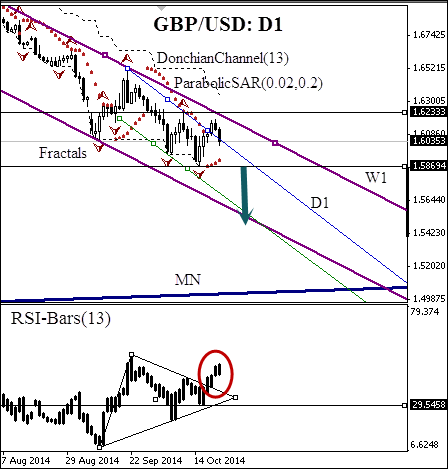
After position opening, Trailing Stop is to be moved after the Parabolic values, near the next fractal peak. Updating is enough to be done every day after a new Bill Williams fractal formation (5 candlesticks). Thus, we are changing the probable profit/loss ratio to the breakeven point.
| Position | Sell |
| Sell stop | below 1.5869 |
| Stop loss | above 1.6233 |
Dear traders. You can see the detailed report of the author’s account by clicking here.
- Sertifika Al

Not:
Bu bilgilendirici ve eğitici bir genel bakıştır ve ücretsiz olarak yayımlanmaktadır. Burada yer alan tüm veriler kamu kaynaklarından alınmış ve az çok güvenilir olarak kabul edilmiştir. Aynı zamanda, bilgilerin tam ve doğru olduğuna dair hiçbir garanti yoktur. Gelecekte bunlar güncellenmemektedirler. Görüşler, göstergeler, grafikler ve kalan her şey dahil olmak üzere her genel bakışta olan tüm bilgiler sadece değerlendirme amacıyla sağlanıp mali dalışmanlık veya tavsiye niteliğinde değildirler. Tüm metin ve onun herhangi bir bölümünü veya grafikleri herhangi bir varlıkla işlem yapmak için bir teklif olarak kabul edilemez. IFC Markets şirketi ve şirket çalışanları bu genel bakışın incelenmesi sırasında veya sonrasında başkası tarafından alınan herhangi bir eylem için hiçbir koşulda sorumlu değildir.
