- Analiz
- Teknik analiz
GBP/USD Teknik Analiz - GBP/USD Ticaret: 2015-03-26
Considering the British pound
On Wednesday more negative macroeconomic data were released in the US. Durable Goods Orders have marked a decrease for 6 consequent months. The indicator dropped 1.4% while investors anticipated 0.2% growth. Therefore several largest investment banks cut their Q4 GDP forecasts from 1.2-2% to 0.9-1.5%. According to Atlanta Reserve Bank estimates, GDP will increase just 0.3%. It is understood, that amid this news US Dollar index continued to pull back. In theory, we may consider opening a short position against dollar using any currency pair. Yesterday we introduced the Canadian dollar and today we would like to draw your attention to GBP/USD. To be noted, today at 10:30 CET Retail Sales will be announced in Great Britain. In our opinion, the tentative outlook is positive. Tomorrow Bank of England chair Mark Carney will speak in Frankfurt while two other board executives will hold meetings in other cities.
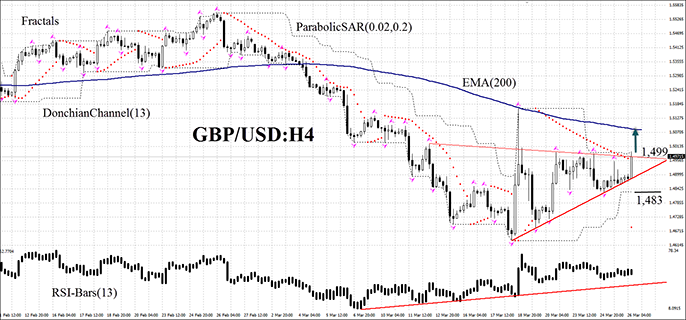
The GBP/USD currency pair breached the previous fractal high on the H4 chart and now shows a bullish momentum. However, it remains within the “triangle” pattern of technical analysis. Donchian Channel hasn't expanded yet, which may indicate lack of volatility. The chart shapes a growing white candle and forms the first Parabolic point, signaling ascending trend. RSI-Bars is located far from the overbought zone but has already exceeded 50. The oscillator marked the bullish divergence earlier but now the market has almost run it down. We do not rule out further bullish momentum if the pound escapes the “triangle” and breaches the fractal high at 1.499. Stop loss may be placed below Donchian Channel lower boundary and the latest fractal low, which may now act as support line – 1.483. Careful investors may place a Stop loss a bit below the trend line at the lowest mark of the “triangle”– 1.488. After pending order placing, Stop loss is to be moved every four hours near the next fractal low, following Parabolic signals. Thus, we are changing the probable profit/loss ratio to the breakeven point. If the price meets Stop loss level without reaching the order, we recommend cancelling the position: market sustains internal changes which were not considered.
| Position | Buy |
| Buy stop | above 1,499 |
| Stop loss | below 1,483 |
- Sertifika Al

Not:
Bu bilgilendirici ve eğitici bir genel bakıştır ve ücretsiz olarak yayımlanmaktadır. Burada yer alan tüm veriler kamu kaynaklarından alınmış ve az çok güvenilir olarak kabul edilmiştir. Aynı zamanda, bilgilerin tam ve doğru olduğuna dair hiçbir garanti yoktur. Gelecekte bunlar güncellenmemektedirler. Görüşler, göstergeler, grafikler ve kalan her şey dahil olmak üzere her genel bakışta olan tüm bilgiler sadece değerlendirme amacıyla sağlanıp mali dalışmanlık veya tavsiye niteliğinde değildirler. Tüm metin ve onun herhangi bir bölümünü veya grafikleri herhangi bir varlıkla işlem yapmak için bir teklif olarak kabul edilemez. IFC Markets şirketi ve şirket çalışanları bu genel bakışın incelenmesi sırasında veya sonrasında başkası tarafından alınan herhangi bir eylem için hiçbir koşulda sorumlu değildir.
