- Analiz
- Teknik analiz
WTI Petrol Teknik Analiz - WTI Petrol Ticaret: 2015-07-01
US oil reserves growth
Let us consider the WTI CFD. In the NetTradeX trading platform it is marked as OIL. On Wednesday Energy Information Administration reported that crude oil reserves increased last week by 2.4mln barrels. It happened for the first time since this April. For this reason WTI futures dropped 3% to its 2-week low. We do not exclude the further bearish movement, which can be driven by a number of factors. The dollar is strengthening ahead of the probable Greek default and the weak euro. The sanctions against Iran are going to be lifted, so the oil export from the country may rise 60% within a year. Meanwhile, the production may increase from 2.8mln to 3.6mln barrels per day. The overall oil extraction by OPEC countries in July grew to its 3-year strongest – 31.6mln barrels daily.
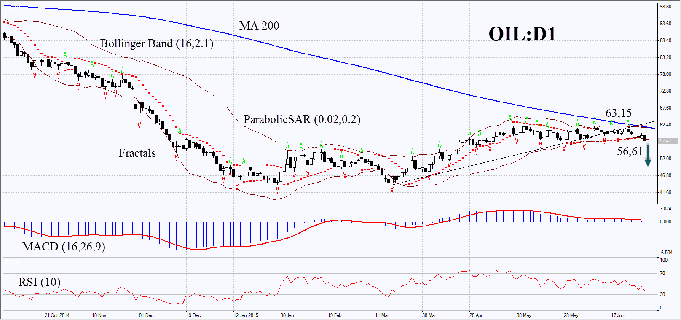
On the daily time frame the OIL futures did not manage to cross the 200-day Moving Average upwards. Last week it breached the support line of the uptrend, which had been in effect for over 2 months. The Parabolic indicator shaped a sell signal. Bollinger Bands narrowed, probably indicating low volatility. They have a negative slope as well. The latest daily bar has gone below the indicator's lower boundary. MACD has been giving a rather weak sell signal, since its bars are too close to the zero level. RSI has been descending but has not yet reached the oversold zone. The bearish momentum may continue, when the latest OIL bar closes under the fractal low at 56.61. A stop loss may be placed at 62.21 mark, supported by the latest Parabolic signal, Bollinger Bands, the 200-day Moving Average and the fractal. It can also be set above the latest local low at 63.15. After pending order placing, the stop loss is supposed to be moved every four hours near the next fractal high, following Parabolic and Bollinger signals. Thus, we are changing the probable profit/loss ratio to the breakeven point. The most cautious traders are recommended to switch to the H4 time frame and place a stop loss, moving it after the trend. If the price reaches the stop level without triggering the order we recommend to cancel the position: the market sustains internal changes that were not considered.
| Position | Sell |
| Sell stop | below 56.61 |
| Stop loss | above 62.21 or 63.15 |
- Sertifika Al

Not:
Bu bilgilendirici ve eğitici bir genel bakıştır ve ücretsiz olarak yayımlanmaktadır. Burada yer alan tüm veriler kamu kaynaklarından alınmış ve az çok güvenilir olarak kabul edilmiştir. Aynı zamanda, bilgilerin tam ve doğru olduğuna dair hiçbir garanti yoktur. Gelecekte bunlar güncellenmemektedirler. Görüşler, göstergeler, grafikler ve kalan her şey dahil olmak üzere her genel bakışta olan tüm bilgiler sadece değerlendirme amacıyla sağlanıp mali dalışmanlık veya tavsiye niteliğinde değildirler. Tüm metin ve onun herhangi bir bölümünü veya grafikleri herhangi bir varlıkla işlem yapmak için bir teklif olarak kabul edilemez. IFC Markets şirketi ve şirket çalışanları bu genel bakışın incelenmesi sırasında veya sonrasında başkası tarafından alınan herhangi bir eylem için hiçbir koşulda sorumlu değildir.
