- Analiz
- Teknik analiz
Teknik Analiz - Ticaret: 2014-12-12
Yen: new energy age
Energy market reorganization governed by the US shale technology has led to increased volatility of currencies in developed countries. Volatility correlation of commodity prices and liquid instruments such as USD/JPY, GBP/USD suggests that non-commodity prices are currently behaving not in a traditional way. Today we demonstrate the impact of a new energy age on the national Japanese currency with the help of GeWorko model. Export-oriented economy of Japan benefited from fallen commodity prices. The tumbled prices for Brent futures from $77 to $73 and a further price decline allowed the Bank of Japan to continue the economic stimulus by conducting quantitative easing without a sharp increase in inflation risks: the refinancing rate has remained at zero level. The currency market was unambiguous about this event: yen dipped 2% in a few days after the OPEC summit. Note also that the Japanese trade surplus from February to November has grown 46%, while Brent futures tumbled 39%. These values are comparable. The 20-day correlation between the yen and Brent over that period was 66-85%. Usually it corresponds to correlation with the loonie as a commodity currency during the times of a stable market, but certainly not with the yen.
To take advantage of these trends, we consider the spread trading instrument &WTI_JPY, composed using Personal Composite Instrument - PCI technology. The basic part of the instrument includes 1 barrel of the US WTI crude oil, and the quoted part - 100 JPY. Get more details and the online &WTI_JPY chart by clicking here. You can also download the instrument for NetTradeX terminal.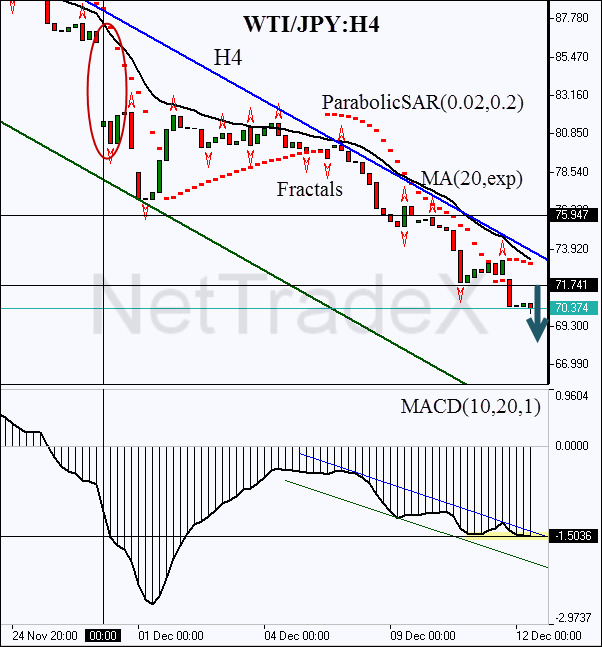
Another significant sign of the downtrend is the bearish gap, which was formed immediately after the OPEC meeting. Thus, it confirms our hypothesis about the Japanese monetary policy and investor’s reaction on it. We deem that a short position can be opened immediately, or (for conservative traders) after the MACD line breakout at 1.5036. Stop Loss can be opened at the crossover of the moving average and the trend line at 75.947. This mark is also confirmed by the Bill Williams resistance fractal.
| Position | Sell |
| Sell stop | below 70.374 |
| Stop loss | above 75.947 |
- Sertifika Al

Not:
Bu bilgilendirici ve eğitici bir genel bakıştır ve ücretsiz olarak yayımlanmaktadır. Burada yer alan tüm veriler kamu kaynaklarından alınmış ve az çok güvenilir olarak kabul edilmiştir. Aynı zamanda, bilgilerin tam ve doğru olduğuna dair hiçbir garanti yoktur. Gelecekte bunlar güncellenmemektedirler. Görüşler, göstergeler, grafikler ve kalan her şey dahil olmak üzere her genel bakışta olan tüm bilgiler sadece değerlendirme amacıyla sağlanıp mali dalışmanlık veya tavsiye niteliğinde değildirler. Tüm metin ve onun herhangi bir bölümünü veya grafikleri herhangi bir varlıkla işlem yapmak için bir teklif olarak kabul edilemez. IFC Markets şirketi ve şirket çalışanları bu genel bakışın incelenmesi sırasında veya sonrasında başkası tarafından alınan herhangi bir eylem için hiçbir koşulda sorumlu değildir.
