- Analiz
- Teknik analiz
Soya Fasulyesi Teknik Analiz - Soya Fasulyesi Ticaret: 2015-11-26
Is upward correction to continue?
The soy prices dipped to fresh low of 6.5 years on Monday and are edging up now amid the drought in India. Will the prices continue to correct upwards?
The soy prices fell to the multiyear lows after the opposition leader Mauricio Macri won the presidential elections in Argentina. Previously, he promised to cut considerably the export duties and to devaluate the national currency to support the local farmers. Due to this, markets expect the 30% increased supply of the Argentina’s soy in the global markets till 2019. The head of the big agribusiness Los Grobo forecasts the soy production in Argentina to increase by 50% in 3 years. Now this positive news is partly offset by the drought in India. The country imports vegetable oil for the value of $10bn. In October its import increased by 34% amounting to 1.65mln tonnes, according to Solvent Extractors' Association. In 2014/15 season the vegetable oil imports increased by 23.6% to 14.6mln tonnes while the soybean oil imports increased to 3mln tonnes from 1.95mln tonnes last season. The major supplier of the palm butter to India is Indonesia but we witness the growing share of high-quality soybean oil.
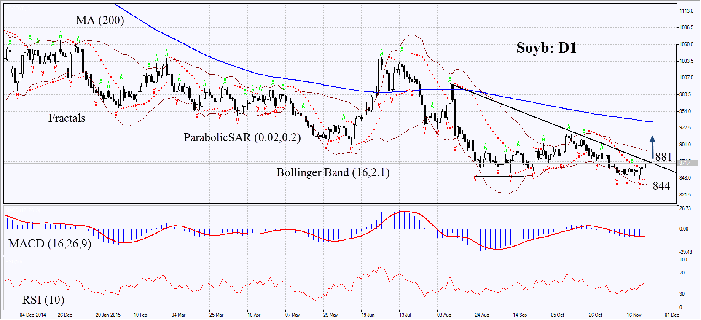
On the daily chart the Soyb: D1 is consolidated near its lowest in 6.5 years. The MACD and Parabolic indicators have formed buy signals. The Bollinger bands have contracted which may mean lower volatility. RSI is above 50, no divergence. The bullish trend may continue in case soy prices break through the resistance of the downtrend at 881. This level may serve the point of entry. The initial risk-limit may be placed below the last lower Parabolic signal, fractal and 6.5-year low at 844. Having opened the pending order we shall move the stop to the next fractal low following the Parabolic and Bollinger signals. Thus, we are changing the probable profit/loss ratio to the breakeven point. The most risk-averse traders may switch to the 4-hour chart after the trade and place there a stop-loss moving it in the direction of the trade. If the price meets the stop-loss level at 844 without reaching the order at 881, we recommend cancelling the position: the market sustains internal changes which were not taken into account.
| Position | Buy |
| Buy stop | above 881 |
| Stop loss | below 844 |
- Sertifika Al

Not:
Bu bilgilendirici ve eğitici bir genel bakıştır ve ücretsiz olarak yayımlanmaktadır. Burada yer alan tüm veriler kamu kaynaklarından alınmış ve az çok güvenilir olarak kabul edilmiştir. Aynı zamanda, bilgilerin tam ve doğru olduğuna dair hiçbir garanti yoktur. Gelecekte bunlar güncellenmemektedirler. Görüşler, göstergeler, grafikler ve kalan her şey dahil olmak üzere her genel bakışta olan tüm bilgiler sadece değerlendirme amacıyla sağlanıp mali dalışmanlık veya tavsiye niteliğinde değildirler. Tüm metin ve onun herhangi bir bölümünü veya grafikleri herhangi bir varlıkla işlem yapmak için bir teklif olarak kabul edilemez. IFC Markets şirketi ve şirket çalışanları bu genel bakışın incelenmesi sırasında veya sonrasında başkası tarafından alınan herhangi bir eylem için hiçbir koşulda sorumlu değildir.
