- Analiz
- Teknik analiz
USD/CAD Teknik Analiz - USD/CAD Ticaret: 2014-10-30
Oil or FOMC?
Yesterday the Federal Open Market Committee (FOMC) minutes revealed the statement confirming the QE3 completion in late October. This decision will result in a steady volume reduction of long-term government bonds purchases. Note that the US Q2 GDP rose 4.6% YoY. Besides, it is planned to keep interest rates at 0-0.25% per annum to maintain economic development with the help of available commercial loans. The main determinants of monetary policy remain to be unemployment and inflation rates. As it was pointed out in the statement, the base rate may be revised only in case the rate exceeds the threshold of 2%. The FOMC statement caused a significant dollar consolidation against the most liquid currencies.
Today we expect the quarterly US GDP release and Unemployment Claims. If the indicator values are at the expected level, we should wait for the general trend to be continued. A relatively modest reaction is observed only by the Canadian dollar. It is explained by the slow recovery in oil prices, which are now traded at $81 per barrel (WTI). Taking the oil component of Canadian exports into account, this fact provides confidence for investors regarding the Canadian currency. However, it is still too early to talk about a steady trend, so if the US figures are confirmed, we would expect the highs of the USDCAD to be updated.
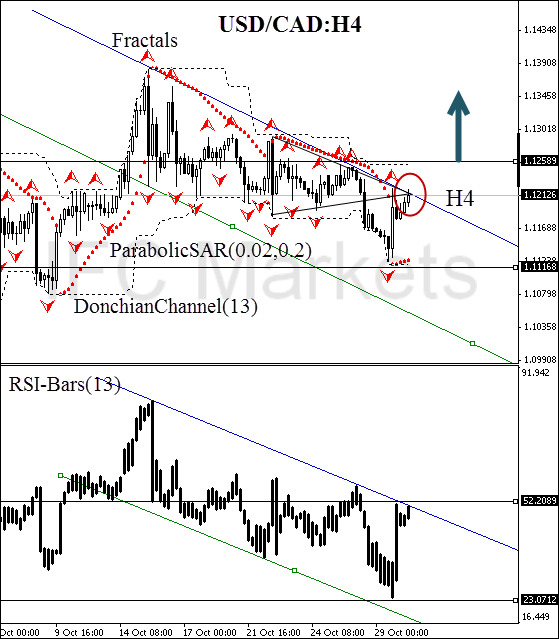
After position opening, Trailing Stop is to be moved after the Parabolic values, near the next fractal low. Updating is enough to be done every day after a new Bill Williams fractal formation (5 candlesticks). Thus, we are changing the probable profit/loss ratio to the breakeven point.
| Position | Buy |
| Buy stop | above 1.12589 |
| Stop loss | below 1.11168 |
Dear traders. You can see the detailed report of the author’s account by clicking here.
- Sertifika Al

Not:
Bu bilgilendirici ve eğitici bir genel bakıştır ve ücretsiz olarak yayımlanmaktadır. Burada yer alan tüm veriler kamu kaynaklarından alınmış ve az çok güvenilir olarak kabul edilmiştir. Aynı zamanda, bilgilerin tam ve doğru olduğuna dair hiçbir garanti yoktur. Gelecekte bunlar güncellenmemektedirler. Görüşler, göstergeler, grafikler ve kalan her şey dahil olmak üzere her genel bakışta olan tüm bilgiler sadece değerlendirme amacıyla sağlanıp mali dalışmanlık veya tavsiye niteliğinde değildirler. Tüm metin ve onun herhangi bir bölümünü veya grafikleri herhangi bir varlıkla işlem yapmak için bir teklif olarak kabul edilemez. IFC Markets şirketi ve şirket çalışanları bu genel bakışın incelenmesi sırasında veya sonrasında başkası tarafından alınan herhangi bir eylem için hiçbir koşulda sorumlu değildir.
