- Analiz
- Teknik analiz
USD/CAD Teknik Analiz - USD/CAD Ticaret: 2014-12-19
"Oil" growth.
Let’s consider the H4 chart of USD/CAD instrument. As oil prices keep falling, we observe the US dollar strengthening against the most liquid currencies. Canadian dollar, traditionally related to commodity currencies, is not an exception. A price is moving inside an H4 upward tendency. We expect a completion of correction at 1.15544 mark. It is crossed by trend line and a lower boundary of the Donchian Channel. A channel slope has a green zone direction as well. 1.15544 mark can be used for risk mitigation after the long position opening. The fractal resistance level 1.16761 in its turn is comfortable for the pending buy order opening. If it happens then a reverse of ParabolicSAR trend indicator will become probable. At the same time a divergence of RSI-Bars oscillator is going to complete. We recommend conservative traders to wait for a breakdown of the oscillator resistance mark 52.3319%.
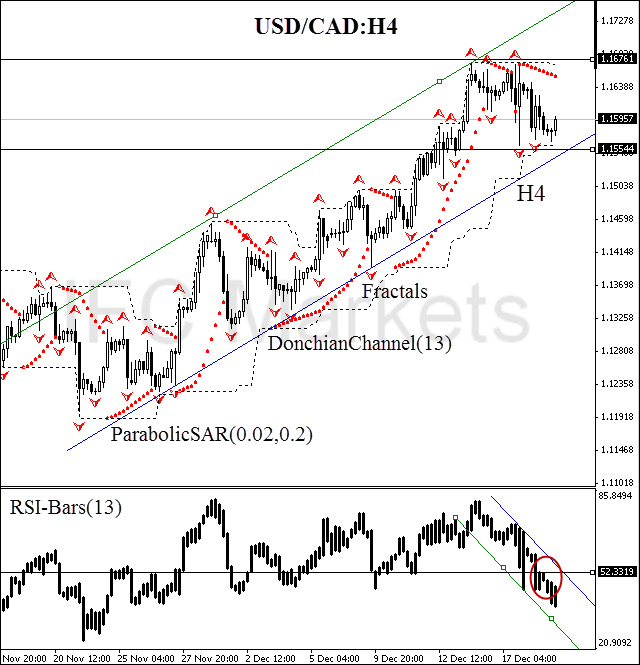
| Position | BUY |
| Buy stop | higher 1.16761 |
| Stop loss | lower 1.15544 |
Dear traders. For the detailed report of the strategy based on analytical issues of technical analysis click here.
- Sertifika Al

Not:
Bu bilgilendirici ve eğitici bir genel bakıştır ve ücretsiz olarak yayımlanmaktadır. Burada yer alan tüm veriler kamu kaynaklarından alınmış ve az çok güvenilir olarak kabul edilmiştir. Aynı zamanda, bilgilerin tam ve doğru olduğuna dair hiçbir garanti yoktur. Gelecekte bunlar güncellenmemektedirler. Görüşler, göstergeler, grafikler ve kalan her şey dahil olmak üzere her genel bakışta olan tüm bilgiler sadece değerlendirme amacıyla sağlanıp mali dalışmanlık veya tavsiye niteliğinde değildirler. Tüm metin ve onun herhangi bir bölümünü veya grafikleri herhangi bir varlıkla işlem yapmak için bir teklif olarak kabul edilemez. IFC Markets şirketi ve şirket çalışanları bu genel bakışın incelenmesi sırasında veya sonrasında başkası tarafından alınan herhangi bir eylem için hiçbir koşulda sorumlu değildir.
