- Analiz
- Teknik analiz
USD/CAD Teknik Analiz - USD/CAD Ticaret: 2015-01-20
Manufacturing sales
Today at 14:30 CET Manufacturing sales will be released in Canada. The indicator is published monthly by Statistics Canada. It’s a leading indicator of consumer spending and employment. For this reason the statistics is important for investors who expect the potential dividends from long-term investment. We assume that the indicator release may result in increased volatility of the Canadian dollar against other liquid currencies.
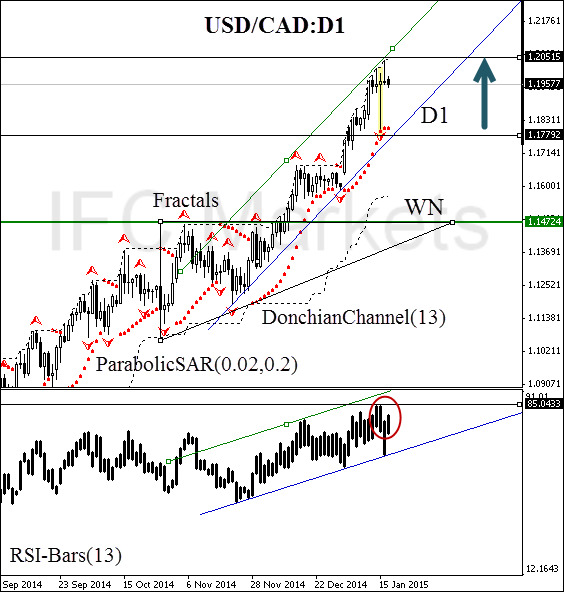
In order to diversify investment possibilities, today we consider USD/CAD on the D1 chart. The price crossed the strong weekly resistance line and formed a new daily uptrend channel. It was accompanied by the breakout of the upper triangle side, which has a bullish bias. ParabolicSAR historical values move along the trend line, increasing its strength. RSI-Bars oscillator also confirms the trend. There is no contradiction on the part of DonchianChannel (13). The price is moving along the upper border, constantly updating the channel peaks. Bulls gained a massive foothold. We deem the next bullish momentum would occur after the fractal resistance crossing at 1.20515. This mark can be used for placing a pending buy order. Conservative investors should wait for the oscillator breakout at 85.0433% to confirm the price breakout. Stop Loss is to be placed below the last support at 1.17792, which is confirmed by the trend line and Parabolic historical values. After order opening, Stop Loss is to be moved after Parabolic values near the next fractal low. Thus, we are changing the probable profit/loss ratio to the breakeven point.
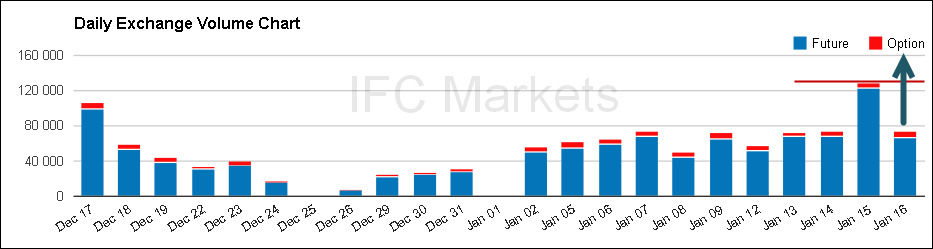
At the moment, the volume of CAD futures traded on the Chicago Mercantile Exchange doesn’t confirm the trend: the level of 120 000 contracts has been outperformed. The most cautious investors are recommended to wait for the breakout of this level to verify the bullish market. You can monitor the trading volumes by clicking here.
| Position | Buy |
| Buy stop | above 1.20515 |
| Stop loss | below 1.17792 |
Dear traders. For the detailed report of the strategy based on analytical issues of technical analysis click here.
- Sertifika Al

Not:
Bu bilgilendirici ve eğitici bir genel bakıştır ve ücretsiz olarak yayımlanmaktadır. Burada yer alan tüm veriler kamu kaynaklarından alınmış ve az çok güvenilir olarak kabul edilmiştir. Aynı zamanda, bilgilerin tam ve doğru olduğuna dair hiçbir garanti yoktur. Gelecekte bunlar güncellenmemektedirler. Görüşler, göstergeler, grafikler ve kalan her şey dahil olmak üzere her genel bakışta olan tüm bilgiler sadece değerlendirme amacıyla sağlanıp mali dalışmanlık veya tavsiye niteliğinde değildirler. Tüm metin ve onun herhangi bir bölümünü veya grafikleri herhangi bir varlıkla işlem yapmak için bir teklif olarak kabul edilemez. IFC Markets şirketi ve şirket çalışanları bu genel bakışın incelenmesi sırasında veya sonrasında başkası tarafından alınan herhangi bir eylem için hiçbir koşulda sorumlu değildir.
