- Analiz
- Teknik analiz
USD/CAD Teknik Analiz - USD/CAD Ticaret: 2015-04-24
Repeating pattern
Let us consider the USD/CAD currency pair on the H4 time frame. The price has been forming a parabolic turn pattern, which was distinguished earlier, before the bearish break-out. The pattern is marked with a rectangle. The general trend makes the pattern repetition more likely. Donchian has turned towards the red zone and the price has consolidated between the support line at 1.20805 and the H4 trend line. The escape from triangle will probably result in a new boost in volatility. ParabolicSAR confirms the market direction: its signals have been moving along the trend.
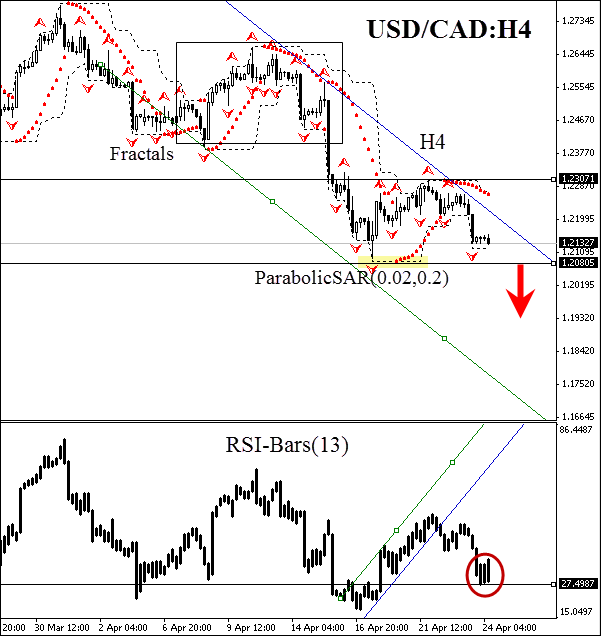
RSI-Bars oscillator supports our assumptions, breaching the bottom of uptrend. At the moment we are expecting a new support level to set at 27%. It is supposed to confirm the trend, if the price breaks out 1.20805 mark. A sell pending order may be placed there. A stop loss is to be placed at 1.23071 mark, which is backed by the Donchian upper boundary. After pending order placing, the stop loss is to be moved every day near the next fractal high, following Parabolic signals. Thus, we are changing the probable profit/loss ratio to the breakeven point. If the price meets the stop loss without reaching the order, we recommend cancelling the position: market sustains internal changes that were not considered.
| Position | Sell |
| Sell stop | below 1.20805 |
| Stop loss | above 1.23071 |
- Sertifika Al

Not:
Bu bilgilendirici ve eğitici bir genel bakıştır ve ücretsiz olarak yayımlanmaktadır. Burada yer alan tüm veriler kamu kaynaklarından alınmış ve az çok güvenilir olarak kabul edilmiştir. Aynı zamanda, bilgilerin tam ve doğru olduğuna dair hiçbir garanti yoktur. Gelecekte bunlar güncellenmemektedirler. Görüşler, göstergeler, grafikler ve kalan her şey dahil olmak üzere her genel bakışta olan tüm bilgiler sadece değerlendirme amacıyla sağlanıp mali dalışmanlık veya tavsiye niteliğinde değildirler. Tüm metin ve onun herhangi bir bölümünü veya grafikleri herhangi bir varlıkla işlem yapmak için bir teklif olarak kabul edilemez. IFC Markets şirketi ve şirket çalışanları bu genel bakışın incelenmesi sırasında veya sonrasında başkası tarafından alınan herhangi bir eylem için hiçbir koşulda sorumlu değildir.
