- Analiz
- Teknik analiz
USD/CHF Teknik Analiz - USD/CHF Ticaret: 2014-10-20
Bearish sentiment
Good afternoon, dear traders. Today we consider the USD/CHF currency pair on the D1 chart. At the moment we can see that the price came out of the uptrend price channel and crossed the trend line downwards. The candlestick pattern “absorption” indicates the trend reversal: the body of the second bearish candlestick exceeds significantly the body of the previous white candlestick (marked in red ellipse on the chart). That means the bullish trend is weak, and now bears are gaining strength. There is no contradiction on the part of the RSI-Bars oscillator: the graphic model “double top” can be observed on the oscillator chart. It outlines the bullish trend termination and the onset of the bearish one. The current downtrend direction is confirmed by the Parabolic values. You can wait for the last confirmatory signal from DonchianChannel, when the price breaks the fractal support level at 0.9358. This mark can be used for placing a pending sell order. Stop Loss is recommended to be placed at 0.9687. The mark is confirmed by Bill Williams fractal, the upper boundary of DonchianChannel and Parabolic values.
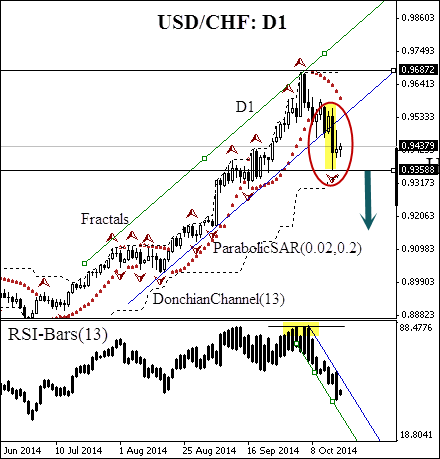
| Position | Sell |
| Sell stop | below 0.93588 |
| Stop loss | above 0.96872 |
Dear traders. You can see the detailed report of the author’s account by clicking here.
- Sertifika Al

Not:
Bu bilgilendirici ve eğitici bir genel bakıştır ve ücretsiz olarak yayımlanmaktadır. Burada yer alan tüm veriler kamu kaynaklarından alınmış ve az çok güvenilir olarak kabul edilmiştir. Aynı zamanda, bilgilerin tam ve doğru olduğuna dair hiçbir garanti yoktur. Gelecekte bunlar güncellenmemektedirler. Görüşler, göstergeler, grafikler ve kalan her şey dahil olmak üzere her genel bakışta olan tüm bilgiler sadece değerlendirme amacıyla sağlanıp mali dalışmanlık veya tavsiye niteliğinde değildirler. Tüm metin ve onun herhangi bir bölümünü veya grafikleri herhangi bir varlıkla işlem yapmak için bir teklif olarak kabul edilemez. IFC Markets şirketi ve şirket çalışanları bu genel bakışın incelenmesi sırasında veya sonrasında başkası tarafından alınan herhangi bir eylem için hiçbir koşulda sorumlu değildir.
