- Analiz
- Teknik analiz
USD/CHF Teknik Analiz - USD/CHF Ticaret: 2014-11-17
Pending Draghi’s speech
Today we expect Mario Draghi to speak before the Committee on Economic and Monetary Affairs at 15:00 (CET) in Brussels. Investors are willing to listen for the ECB President’s comments regarding the low inflation rate and the EU economic slowdown. The main danger for the EU economy is still the possibility of deflation with a consequenе reduction of revenue and output profitability. Mario Draghi’s speech may affect the volatility of the most liquid currency pairs which are exposed to the EU monetary policy.
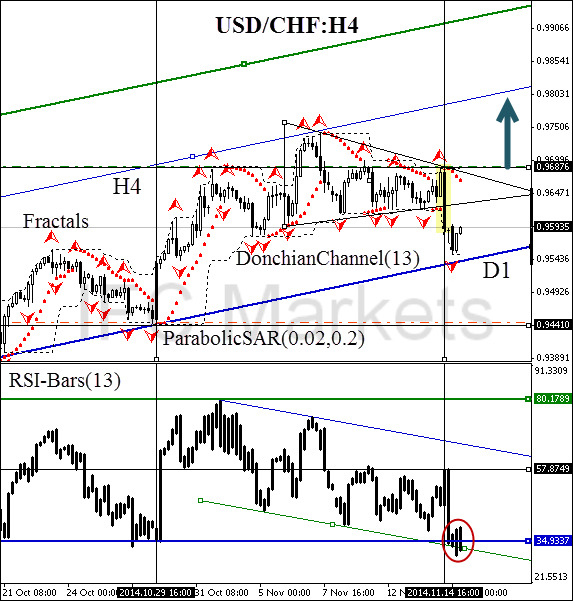
After position opening, Stop Loss is to be moved after the Parabolic values, near the next fractal low. Updating is enough to be done every day after a new Bill Williams fractal formation (5 candlesticks). Thus, we are changing the probable profit/loss ratio to the breakeven point.
| Position | Buy |
| Buy stop | above 0.96876 |
| Stop loss | below 0.94410 |
Dear traders. For the detailed report of the strategy based on the analytical issues of technical analysis click here.
- Sertifika Al

Not:
Bu bilgilendirici ve eğitici bir genel bakıştır ve ücretsiz olarak yayımlanmaktadır. Burada yer alan tüm veriler kamu kaynaklarından alınmış ve az çok güvenilir olarak kabul edilmiştir. Aynı zamanda, bilgilerin tam ve doğru olduğuna dair hiçbir garanti yoktur. Gelecekte bunlar güncellenmemektedirler. Görüşler, göstergeler, grafikler ve kalan her şey dahil olmak üzere her genel bakışta olan tüm bilgiler sadece değerlendirme amacıyla sağlanıp mali dalışmanlık veya tavsiye niteliğinde değildirler. Tüm metin ve onun herhangi bir bölümünü veya grafikleri herhangi bir varlıkla işlem yapmak için bir teklif olarak kabul edilemez. IFC Markets şirketi ve şirket çalışanları bu genel bakışın incelenmesi sırasında veya sonrasında başkası tarafından alınan herhangi bir eylem için hiçbir koşulda sorumlu değildir.
