- Analiz
- Teknik analiz
USD/JPY Teknik Analiz - USD/JPY Ticaret: 2014-10-22
Japanese yen choosing way
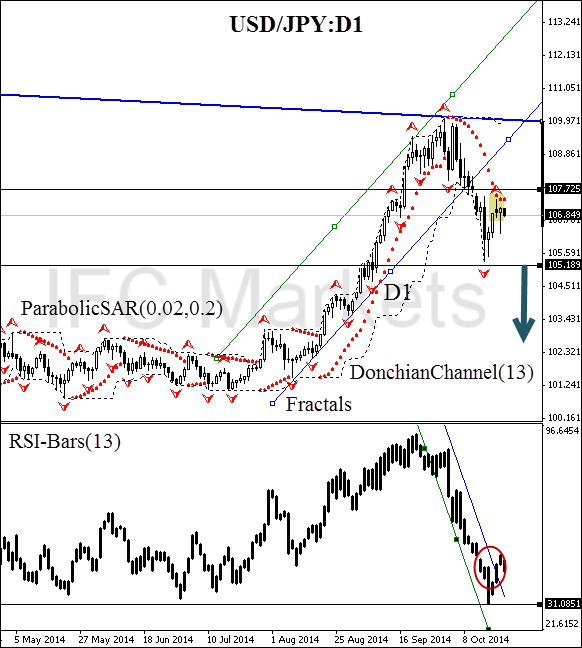
Today we consider the USD/JPY currency pair on the D1 chart. The price made a reversal, touching the strong W1 resistance line. The daily uptrend channel is breached in the direction of the red zone, and now we have every reason to believe that a new bearish D1 trend is emerging. Parabolic confirms the trend direction and moves along the DonchianChannel lower boundary, verifying the price direction. The only alarming signal can be seen at the moment is the breach of RSI-Bars resistance line, which may be proved false. To confirm the bearish sentiment, you should wait for the oscillator level crossing at 31.0851%.
This event is expected to happen before the fractal support breach at 105.189. This mark is strengthened by DonchianChannel lower boundary and can be used for placing a pending sell order. Stop Loss can be placed at 107.725 or 109.971 (for conservative traders). It should be noted that the importance of the last fractal peak is confirmed by the Parabolic historical value, and also the bearish candlestick pattern “shooting star”, which is marked in yellow on the chart.
After position opening, Trailing Stop is to be moved after the Parabolic values, near the next fractal peak. Updating is enough to be done every day after the formation of 5 new candlesticks, needed for the Bill Williams fractal formation. Thus, we are changing the probable profit/loss ratio to the breakeven point.
| Position | Sell |
| Sell stop | below 105.189 |
| Stop loss | above 107.725 |
Dear traders. You can see the detailed report of the author’s account by clicking here.
- Sertifika Al

Not:
Bu bilgilendirici ve eğitici bir genel bakıştır ve ücretsiz olarak yayımlanmaktadır. Burada yer alan tüm veriler kamu kaynaklarından alınmış ve az çok güvenilir olarak kabul edilmiştir. Aynı zamanda, bilgilerin tam ve doğru olduğuna dair hiçbir garanti yoktur. Gelecekte bunlar güncellenmemektedirler. Görüşler, göstergeler, grafikler ve kalan her şey dahil olmak üzere her genel bakışta olan tüm bilgiler sadece değerlendirme amacıyla sağlanıp mali dalışmanlık veya tavsiye niteliğinde değildirler. Tüm metin ve onun herhangi bir bölümünü veya grafikleri herhangi bir varlıkla işlem yapmak için bir teklif olarak kabul edilemez. IFC Markets şirketi ve şirket çalışanları bu genel bakışın incelenmesi sırasında veya sonrasında başkası tarafından alınan herhangi bir eylem için hiçbir koşulda sorumlu değildir.
