- Analiz
- Teknik analiz
USD/JPY Teknik Analiz - USD/JPY Ticaret: 2014-10-29
Yen climbing
Here we consider the USD/JPYcurrency pair on the daily chart. The price is influenced by the daily uptrend, and after a slight retracement, we have all the more reason to believe in the bullish victory. The current price direction is confirmed by Parabolic historical values. There is no contradiction on the part of RSI-Bars oscillator: its values are moving upwards within the bullish trend. We can wait for an additional confirmatory signal from DonchianChannel after the breakout of the last fractal price level at 108.353. It will be preceded by the last high crossing at 58.5870% on the oscillator chart. It is recommended to use the level at 110.064 for placing a pending buy order. It is confirmed by the intersection with D1 and MN resistance lines and the Bill Williams fractal. When the price would cross the monthly resistance line, a strong bullish momentum is expected. Stop Loss is better to be placed at 105.163, which is strengthened by the intersection with the daily trend line, fractal and Parabolic historical values.
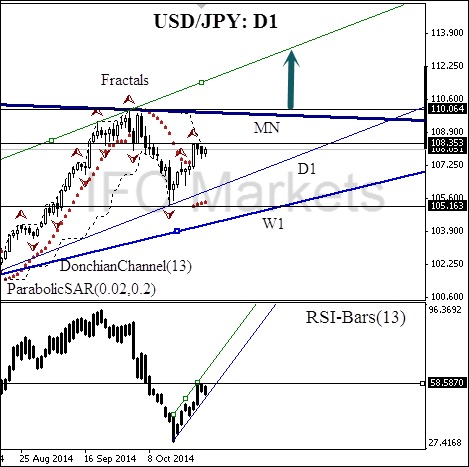
| Position | Buy |
| Buy stop | above 110.064 |
| Stop loss | below 105.163 |
Dear traders. You can see the detailed report of the author’s account by clicking here.
- Sertifika Al

Not:
Bu bilgilendirici ve eğitici bir genel bakıştır ve ücretsiz olarak yayımlanmaktadır. Burada yer alan tüm veriler kamu kaynaklarından alınmış ve az çok güvenilir olarak kabul edilmiştir. Aynı zamanda, bilgilerin tam ve doğru olduğuna dair hiçbir garanti yoktur. Gelecekte bunlar güncellenmemektedirler. Görüşler, göstergeler, grafikler ve kalan her şey dahil olmak üzere her genel bakışta olan tüm bilgiler sadece değerlendirme amacıyla sağlanıp mali dalışmanlık veya tavsiye niteliğinde değildirler. Tüm metin ve onun herhangi bir bölümünü veya grafikleri herhangi bir varlıkla işlem yapmak için bir teklif olarak kabul edilemez. IFC Markets şirketi ve şirket çalışanları bu genel bakışın incelenmesi sırasında veya sonrasında başkası tarafından alınan herhangi bir eylem için hiçbir koşulda sorumlu değildir.
