- Analiz
- Teknik analiz
Altın Teknik Analiz - Altın Ticaret: 2014-10-15
Standard making adjustments
Good afternoon, dear traders. Today Gold Standard Ventures, Nevada gold mining corporation, has released the data on the company’s core project, Railroad-Pinion Gold Project. All the works are done in the area of gold deposits named Carlin, not far from the Emigrant mine. The program of the sample analysis was launched in August 2014, in order to assess the project prospects. Today it has become aware that samples contained high gold content: 0.18 - 2.93 grams per ton of ore. According to the official data released, it would allow the company to increase the production volume and attract new funds to the Pinion project. The outlook for the supply growth in the gold market affected the trading results, which are influenced today by the bearish sentiment.
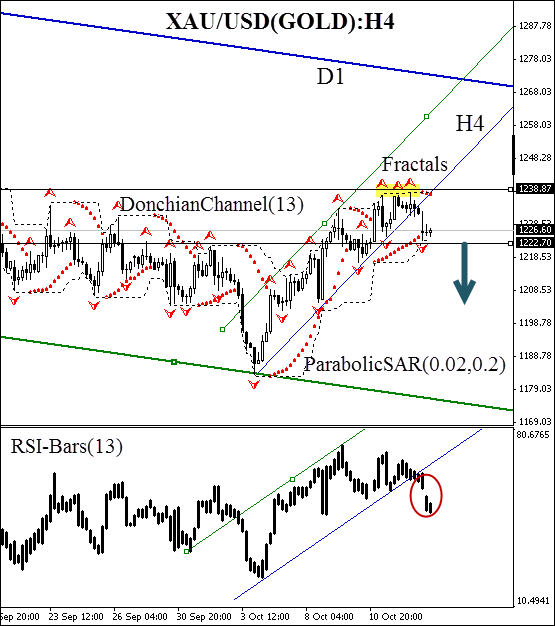
After position opening, Trailing Stop is to be moved after the Parabolic values, near the next fractal peak. Updating is enough to be done every day after the formation of 5 new H4 candlesticks, needed for the Bill Williams fractal formation. Thus, we are changing the probable profit/loss ratio to the breakeven point.
| Position | Sell |
| Sell stop | below 1222.70 |
| Stop loss | above 1238.87 |
Dear traders. You can see the detailed report of the author’s account by clicking here.
- Sertifika Al

Not:
Bu bilgilendirici ve eğitici bir genel bakıştır ve ücretsiz olarak yayımlanmaktadır. Burada yer alan tüm veriler kamu kaynaklarından alınmış ve az çok güvenilir olarak kabul edilmiştir. Aynı zamanda, bilgilerin tam ve doğru olduğuna dair hiçbir garanti yoktur. Gelecekte bunlar güncellenmemektedirler. Görüşler, göstergeler, grafikler ve kalan her şey dahil olmak üzere her genel bakışta olan tüm bilgiler sadece değerlendirme amacıyla sağlanıp mali dalışmanlık veya tavsiye niteliğinde değildirler. Tüm metin ve onun herhangi bir bölümünü veya grafikleri herhangi bir varlıkla işlem yapmak için bir teklif olarak kabul edilemez. IFC Markets şirketi ve şirket çalışanları bu genel bakışın incelenmesi sırasında veya sonrasında başkası tarafından alınan herhangi bir eylem için hiçbir koşulda sorumlu değildir.
