- Analiz
- Teknik analiz
Rus rublesi'ne karşı Altın Teknik Analiz - Rus rublesi'ne karşı Altın Ticaret: 2015-07-29
Getting ready for strengthening trend
Today we consider the &XAURUB personal composite instrument on the daily chart. The PCI demonstrates gold price dynamics in relation to the Russian rouble. The base part of the instrument contains 1 gold ounce, while the quoted one includes 1 rouble. Two weeks ago gold plunged to the minimum since February, 2010 and has been traded in a range from then onwards. The world's largest fund SPDR Gold Trust reports the reserves to hit the minimum since September, 2008, making 21.9mln ounces. We believe that gold futures will advance if Fed postpones rate hike. The Russion rouble lost about 20% to the dollar as oil prices dropped 20% as well. The rouble may show a sharp growth due to the policy of Russian central bank, which buys dollars to increase currency reserves. The bank may cut the key rate in Russia on its regular meeting, expected July, 31.
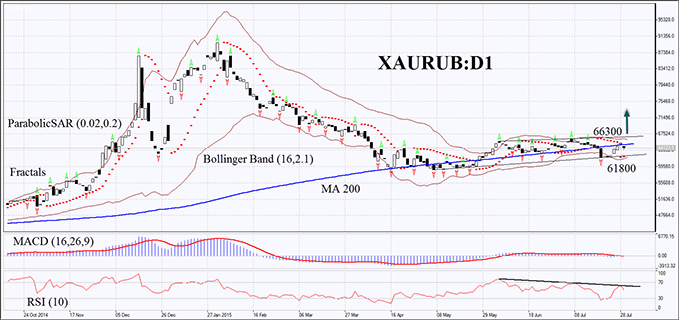
On the daily chart the XAURUB switched to an uptrend in May. It has been fluctuating near the 200-day Moving Average with a positive slope. The Parabolic indicator has formed a sell signal. Bollinger Bands narrowed, indicating low volatility. MACD bars have a small amplitude, so the indicator does not give clear signals. RSI-Bars has formed a bearish trend, moving around 50. In theory, it may show the uptrend weakness. The bullish momentum may develop if the PCI closes above the fractal high, the 200-day Moving Average and the Bollinger upper boundary at 66300. In such a case the RSI-Bars indicator should cross up the descending trend. A stop loss may be placed below the Parabolic signal, the latest fractal low and the Bollinger Band at 61800. After pending order activation the stop loss is supposed to be moved every four hours to the next fractal low, following Parabolic and Bollinger signals. Thus, we are changing the probable profit/loss ratio to the breakeven point. The most cautious traders are recommended to switch to the H4 time frame and place a stop loss there, moving it after the trend. If the price reaches the stop loss without triggering the order, we recommend to cancel the position: the market sustains internal changes that were not considered.
| Position | Buy |
| Buy stop | above 66300 |
| Stop loss | below 61800 |
- Sertifika Al

Not:
Bu bilgilendirici ve eğitici bir genel bakıştır ve ücretsiz olarak yayımlanmaktadır. Burada yer alan tüm veriler kamu kaynaklarından alınmış ve az çok güvenilir olarak kabul edilmiştir. Aynı zamanda, bilgilerin tam ve doğru olduğuna dair hiçbir garanti yoktur. Gelecekte bunlar güncellenmemektedirler. Görüşler, göstergeler, grafikler ve kalan her şey dahil olmak üzere her genel bakışta olan tüm bilgiler sadece değerlendirme amacıyla sağlanıp mali dalışmanlık veya tavsiye niteliğinde değildirler. Tüm metin ve onun herhangi bir bölümünü veya grafikleri herhangi bir varlıkla işlem yapmak için bir teklif olarak kabul edilemez. IFC Markets şirketi ve şirket çalışanları bu genel bakışın incelenmesi sırasında veya sonrasında başkası tarafından alınan herhangi bir eylem için hiçbir koşulda sorumlu değildir.
